( 経済学、リンク::::::::::)
ゲゼル:減価式貨幣と世界通貨案 1914
http://nam-students.blogspot.jp/2011/12/blog-post_4033.html?m=0
Irving Fisher: Stamp Scrip; 1933 :スタンプ通貨 アーヴィング・フィッシャー (著)
http://nam-students.blogspot.jp/2015/12/irving-fisher-stamp-scrip-1933-2016331.html
(フィリップス曲線の発見者とは別人)チェスター.・フィリップスの信用創造論1931
http://nam-students.blogspot.jp/2011/12/blog-post_4033.html?m=0
Irving Fisher: Stamp Scrip; 1933 :スタンプ通貨 アーヴィング・フィッシャー (著)
http://nam-students.blogspot.jp/2015/12/irving-fisher-stamp-scrip-1933-2016331.html
(フィリップス曲線の発見者とは別人)チェスター.・フィリップスの信用創造論1931
NAMs出版プロジェクト: Fisher, 1926 アルバン・フィリップス曲線の発見
http://nam-students.blogspot.jp/2017/05/and-found-i-discovered-phillips-curve.html@
水をくみ上げ、経済情勢をシミュレートし、未来を予測する、1949年製のコン ピ ューター「MONIAC」|WIRED.jp
http://nam-students.blogspot.jp/2017/05/1949-moniacwiredjp.html
#18 Phillips Curve
mitchell 2013/2/15,21
瀧澤弘和 現代経済学 2018/8
https://nam-students.blogspot.com/2018/12/2018_31.html
- The American Economic Review
JOURNAL ARTICLE
Analytical Aspects of Anti-Inflation Policy
Paul A. Samuelson and Robert M. Solow
The American Economic Review
Vol. 50, No. 2, Papers and Proceedings of the Seventy-second Annual Meeting of the American Economic Association (May, 1960), pp. 177-194
Published by: American Economic Association
https://www.jstor.org/stable/1815021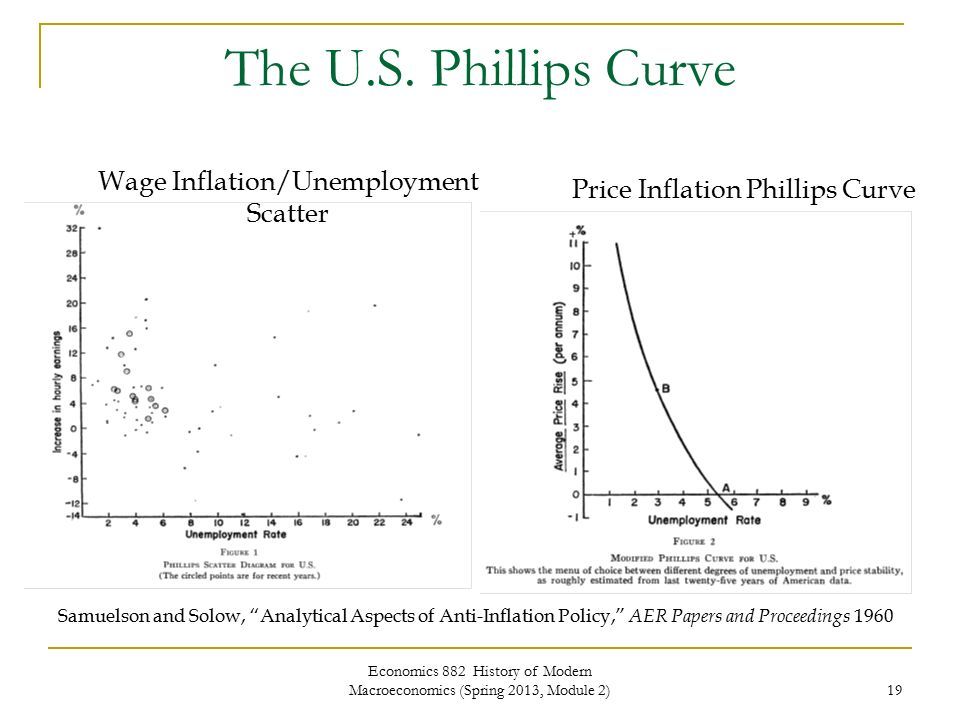
清家労働経済学112参照サミュエルソンとソローが賃金上昇率を物価に置き換えたというがフィッシャーはすでに物価を変数としていた
Fisher, Irving. “A Statistical Relation between Unemployment and Price Changes.” 1926


The Relation between Unemployment and the Rate of Change of Money Wage Rates in the United Kingdom, 1861-1957 A. W. Phillips Economica, New Series, Vol. 25, No. 100. (Nov., 1958), pp. 283-299.


右下がりのフィリップス曲線を短期フィリップス曲線、失業率がuNの水準で垂直に通過する直線を長期フィリップス曲線という。
フィリップス曲線\_
短期フィリップス曲線\
長期フィリップス曲線I
πt=Et-1(πt)-β(ut-uN)
縦軸はインフレ率π、横軸は失業率u
uNは自然失業率、utはt期の失業率、βは正の定数
Et-1(・)はt-1期の情報に基づく条件付きの期待値
二神他マクロ経済学2000,363~4頁
期待インフレ率の上昇に伴って、フィリップス曲線は上方にシフトする。
Et+1と未来の期待値を取り入れるのがNKP曲線
A Statistical Relation between Unemployment and Price Changes
Professor Irving Fisher
Professor of Economics, Yale University
The possible relation between changes in the price level and changes in the volume of employment, much discussed by economists at the present time, has already been debated in the pages of the Review. In the present article Professor Fisher, one of the foremost authorities on monetary problems and for years a protagonist of stabilisation, removes the question from the sphere of controversy to that of exact statistical research. He has found a remarkably high correlation between the rate of price changes and employment, and he describes the methods by which he has achieved this result. The data used refer exclusively to the United States, and further research would be required before the conclusions could be applied directly to other countries. Nevertheless, this objective statistical confirmation of a relation long asserted to exist is a highly important step in advance. From International Labour Review 13, no. 6 (June 1926): 785-92. 496


LOST AND FOUND 499


LOST AND FOUND 501

502 JOURNAL OF POLITICAL ECONOMY


In a matter as intensely human as the employment problem it seems a far cry from money and banking to an explanation of why working men are thrown out of jobs. And yet, in the significant period 1915-1925, analysis shows a Pearsonian correlation as high as 90 per cent, between the rate of change in the value of the dollar and unemployment in the United States.
The fact that deflation causes unemployment has been well recognised for many years in isolated instances, such as the great deflation of 1921 in America or the corresponding post-war deflation in Great Britain, Czecho- slovakia, or Norway. It has likewise been recognised that inflation carries with it a great stimulation to trade and an increase in employment (or decrease in unemployment). And yet, strange as it may seem, when applied to the so-called "business cycle", these relationships have been almost wholly overlooked. When, for instance, Mr. Hoover had his committee of experts study unemployment and make a report to him three years ago, almost every other factor that might influence employment was given careful consideration, but references to inflation and deflation were almost wholly absent'.
It would also seem that many economists and statisticians ascribe a sort of fatalistic nature to the so-called business cycle. At any rate, when study- ing this ebb and flow of the tides of business and industry, they seem to forget to give any serious consideration to inflation and deflation. In con- sequence we have the anomaly that, while it is a commonplace that long- continued or sharp inflation or deflation will be reflected in the figures of employment or unemployment, nevertheless, when it comes to the alter- nation of what is called (or miscalled) "the business cycle"-booms and depressions in trade, times of full employment and great unemployment, occurring in rapid succession-the relation of these phenomena to money and banking is largely forgotten.
Having been interested for many years in all the effects of changes in the purchasing power of the dollar-in other words, in changes in the general level of prices-I have long studied the effects of those changes on employment, as revealed by statistics. During the last three years in particular I have had at least one computer in my office almost constantly at work on this problem, and have made reports of progress at various meetings of the American Statistical Association. Last June a final report was made, on the effect of changes in the purchasing power of the dollar on the so-called business cycle2. What is here presented is largely based on that report, but has special reference to unemployment. In that report a correlation was found even
1 Business Cycles and Unemployment. New York, McGraw-Hill Book Co., 1923. XL + 405 pp. Cf. pp. 270-271: "Proposals to Stabilise the Dollar".
2 Irving FIsHER: "Our Unstable Dollar and the So-called Business Cycle", in Journal of the American Statistical Association, June 1925, pp. 179-202.
498 JOURNAL OF POLITICAL ECONOMY
higher than the 90 per cent for employment reported here, namely, 94.1 per cent. That is, by correlating the volume of trade3 with the changes in the price level, not with the price level itself, and assuming a certain "distributed lag" between the two, we obtain this high correlation of 94.1 per cent. (+ 941). This correlation is so high as largely to explain the major fluctuations of the so-called business cycle without reference to any of the conventional explanations.
This high correlation reinforces my extreme scepticism about the neces- sary existence, in any important practical sense, of "the busines cycle", though I realise that there must be present many diverse influences affect- ing the ups and downs of business. Or rather I believe that there are always many cycles, more or less blended, but that they are so intertwined that the "business cycle", or net resultant behaviour of business, as we see it in the statistics of trade, is largely a reflection not of those numerous and conflicting cyclical movements so much as of the course of our unstable dollar.
The correlation for unemployment, while not quite as high as for trade, is sufficiently high to enable us to say that for the period considered- between 1915 and the present-changes in the purchasing power of the dollar may very largely explain changes in employment. The principle underlying this relationship is, of course, familiar. It is that when the dollar is losing value, or in other words when the price level is rising, a business man finds his receipts rising as fast, on the average, as this general rise of prices, but not his expenses, because his expenses consist, to a large extent, of things which are contractually fixed, such as interest on bonds; or rent, which may be fixed for five, ten, or ninety-nine years; or salaries, which are often fixed for several years; or wages, which are fixed sometimes either by contract or custom, for at least a number of months. For this and other reasons, the rise in expenses is slower than the rise in receipts when inflation is in progress and the price level is rising or the dollar falling. The business man, therefore, finds that his profits increase. In fact, during such periods of rapid inflation, when profits increase because prices for receipts rise faster than expenses, we nickname the profit-taker the "profiteer". Employment is then stimulated-for a time at least.
The ultimate effects of a long-continued inflation are doubtless bad all round, and even during the period when it does help to provide jobs for the labouring man it raises the cost of living against him.
On the other hand, when prices are falling, expenses likewise lag behind and reduce profits, for exactly the same reason turned about. Consequently, during periods of falling prices profits are reduced, bankruptcies are in- creased, concerns shut down entirely or in part, and men are thrown out of work.
Therefore, what we find in our statistics is exactly what we would expect, 3 According to the indexes worked out by the Harvard Committee on Economic Research.
LOST AND FOUND 499
namely that unemployment is correlated with the purchasing power of the dollar.
A word may be said here as to the technique of the statistical analysis used and to explain why this close correspondence between unemployment and changes in the purchasing power of money has been so often over- looked. The primary reason is, I believe, the failure to perceive the im- mense difference as regards influence on business between the price level and changes in the price level, between high and low prices on the one hand and the rise and fall of prices on the other.
It is not a high price level that makes for full employment or a low price level that makes for unemployment. Whether a price level is high or low has, in the long run, nothing whatever to do with employment. We might have a price level one hundred times as high as we have today; and yet, as long as it remained at that height without rising or falling for a period of years, there would be no reason to expect, as a consequence, any especially full employment.
Again, we might have a price level ten times as low as our present price level, and yet, if it remained there, it would not tend to create depression of trade or unemployment. But if we sink from one level to another, then, during the time of falling, we do produce depression of trade and unem- ployment. Reversely, if we rise from one level to another, then during the period of rising we do for a time produce more employment.
In running an automobile we know that it takes no more petrol on a high plateau than on the lowlands, but that it does take much more petrol when we are going uphill; and, on the other hand, takes less when we are going downhill. It is the going uphill or downhill of the price level on which we should fix attention. We need to picture not merely the price itself, but its rates of change.
In Chart I we see at the bottom a curve P, tracing the price level in the United States between 1903 and 1925. It oscillates somewhat, but rises gradually to 1916 and then suddenly, as a consequence of the war infla- tion, goes up, at first very rapidly, reaching its peak in May 1920, from which point it falls back about halfway to January 1922. From that time it oscillates somewhat, but not as violently as before.
If now we try to correlate this curve with a curve for employment or unemployment, we find very little relationship. But if we take the rate of change of this curve and plot it, we find a very close relationship. Let us look at the curve called P', which oscillates very rapidly. This P' indicates the rate of change of the lower curve P. That is, while P represents the price level itself, P' represents its "first derivative", or rate of change.
This relationship between P' and P is in essence very simple. When P is running horizontally, whether it is high or low, P' is zero, because there is no rise or fall. When P is running uphill, P' is high. When P is going down- hill, P' is below zero. Now we find that P' is more intimately associated with employment than
500 JOURNAL OF POLITICAL ECONOMY
PI- I PEE - IK - EKE - L - EK E IKE 1 I |E 150 clerl. This -ZdnUGmas fatidcrv ' eie fo h eod '-140 .z _+~~~~~~~~~~~~~~~~~~~~~~~120
is P. But some
cleary
P'
and 0 cleare to th~ii 01Iw ink of ' as n acrt u icompoit if P. onz ith hypothesis~
that the effect is distributed. In other words, P' is considered as having its effect on employment, not all at once, but after a certain lag. If this lag were a fixed lag we would merely need to shove the curve P' bodily ahead by a certain number of months. This is the usual statistical technique in connecting one curve with another by a lag.
But it stands to reason that correlating with a fixed lag is an extremely inadequate method; for if, at any one time, inflation is going on rapidly, as shown by the rapid ascent of the P curve (or the high peak of the P' curve), the effect on employment will not certainly wait for seven months and then suddenly explode, or be felt all at once, and after that not be felt at all. Instead, its effect will be distributed. It is on this consideration of the actual facts of economic action that I have introduced the idea of a distributed lag. The law of distribution of the lag is somewhat analogous to the typical law of errors, expressed by the corresponding frequency curve. Having tried various types of frequency or probability curves, I have found that one approximating to a simplified "geometrical" probability curve (a curve which, if plotted on logarithmic paper, is a "normal" probability curve) seems best suited to show the effect of P' on unemployment or employment.
The details are fully explained in the paper already referred to. There the distribution of the effect is somewhat as follows: for any particular
LOST AND FOUND 501
spurt P' in prices, about three per cent. of the effect will be felt in a month; six per cent. in the second month; seven per cent. in the third, fourth and fifth months respectively, after which the effects will gradually taper off4. In the case of price changes and unemployment the tapering off is very abrupt instead of gradual.
For any one point of time we can now build up, from the effects of a certain aggregate of previous P's-or spurts of pieces upward or downward -their full effect as felt at that one point of time. So built up, we get the curve P' (magnified vertically in order to make it more comparable with the other curves). We have now reached P' as derived, in two stages, from the curve P. This P' represents the composite effects of the rates of rise and fall of the price level, or the "dance of the dollar".
We next note in Chart II the relation between this dance of the dollar as shown by the curve P', and the fluctuations in employment as shown by the curve E. The dotted curve E represents employment according to the statistics of the Harvard Committee of Economic Research5.
It does not require any correlation coefficient to see that there is a remarkably strong resemblance between the two curves, not only between their major fluctuations but also, one is tempted to believe, between their minor changes, as seen from month to month. We notice, for instance, a clear relationship in the depression of 1908, as also in the boom period of 1917, and in the recession of 1921.
The correlation between P' and E for the period 1915-1925 is 90 per cent., as already stated6. The question now arises whether this conclusion (i.e. of a strong connection between price changes and-unemployment) may not be partly vitiated by the fact that I have adjusted the type of proba- bility curve underlying the lag, selecting it out of various possible types of probability curves as the one which gives the maximum correlation. In order to test this, as will be seen from the article referred to, I have ap- plied the curve type with which the maximum correlation for one period was obtained to other periods for which no such selection was tried; and, vice versa, I have tried for the maximum fit for the first period and also
4In the present paper the correlation is based on the simplified method described on p. 198, note 1, of "Our Unstable Dollar and the So-called Business Cycle". The short time between the outbreak of the war and September 1915 was excluded be- cause, as indicated in the article cited, the influence of the sudden outbreak of the war is irrelevant to this study.
5 The Committee obtained its material from various sources, including statistics of both employment and unemployment. These were put together into one index after verifying the strong inverse correlation between them.
6 This high correlation can be obtained only by employing the method of "distributed lag".
The highest correlation between price-change and employment with a fixed lag is only 79 per cent. This is for a lag for four months. A three months' fixed lag reduces it to 62 per cent. On the other hand the use of a properly distributed lag raises the correlation to 90 per cent. These figures are all for the period September 1915- December 1924, during most of which violent price changes were occurring. For periods of less violent price changes the correlation is less.
502 JOURNAL OF POLITICAL ECONOMY
for the second. It turns out that the lowering of the correlation thereby caused is almost negligible. The calculations were carried back to 1877, the earliest time for which the statistics are available.
T-3- KI? *Z5- Z .5 .__5 ij~~~~~~~~~~~~~ ~~E - l -30--- ??? o -:39 -3~~~~~~~~~~~913z1213.9 4 [EMPLYMENT (E) P&IlE [HAN[E PROJE[ETD (E|)
We may, therefore, feel certain that changes in the price level do definitely foreshadow or anticipate changes in employment. Of course, this relationship might conceivably not be causal. So far as the statistics are concerned, instead of P' being the cause of E, both might conceivably be caused by some third influence. Or it might be conceived that price-change simply represents a forecast of good or bad business. In fact, I have little doubt that both these views contain elements of truth.
But as the economic analysis already cited certainly indicates a causal relationship between inflation and employment or deflation and unem- ployment, it seems reasonable to conclude that what the charts show is largely, if not mostly, a genuine and straightforward causal relationship; that the ups and downs of employment are the effects, in large measure, of the rises and falls of prices, due in turn to the inflation and deflation of money and credit.
In short, facts and theory both indicate that in the "dance of the dollar" we have the key, or at any rate a very important key, to the major fluctua- tions in employment. If this conclusion be sound, we have in our power, as a means of substantially preventing unemployment, the stabilisation of the purchasing power of the dollar, pound, franc, lira, mark, crown, and any other monetary units.
This content downloaded from 126.235.28.162 on Sun, 28 May 2017 09:17:47 UTCAll use subject to http://about.jstor.org/terms
アルバン・ウィリアム・フィリップス - Wikipedia
https://ja.m.wikipedia.org/wiki/%E3%82%A2%E3%83%AB%E3%83%90%E3%83%B3%E3%83%
https://ja.m.wikipedia.org/wiki/%E3%82%A2%E3%83%AB%E3%83%90%E3%83%B3%E3%83%
アルバン・ウィリアム・ハウスゴー・フィリップス(アルバン・W・フィリップス、Alban William Housego Phillips、1914年11月18日 - 1975年3月4日)は、ニュージーランド生まれの有力な経済学者である。フィリップスは彼の研究生活の大半をロンドン・スクール・オブ・エコノミクス(LSE)で過ごした。
彼の最も有名な貢献は、彼が1958年に初めて描いたフィリップス曲線である。彼はまた、1949年にMONAICという水力の経済学コンピュータを設計・製作した。
彼の最も有名な貢献は、彼が1958年に初めて描いたフィリップス曲線である。彼はまた、1949年にMONAICという水力の経済学コンピュータを設計・製作した。
| ネオケインジアン経済学 | |
|---|---|
_Phillips.jpg) | |
| 生誕 | 1914年11月18日 |
| 死没 | 1975年3月4日(60歳) |
| 影響を 受けた人物 | アーヴィング・フィッシャー ジョン・メイナード・ケインズ |
| 影響を 与えた人物 | ポール・サミュエルソン ロバート・ソロー エドムンド・フェルプス |
| 実績 | 失業と価格変動の関連性(フィリップス曲線) |
経歴
- 1914年、ニュージーランドに酪農家の息子として生を享ける。
- 学校を卒業する前にニュージーランドを離れ、オーストラリアでワニのハンターや映画館のマネージャーなど、様々な職を経験。
- 1937年に中国へ訪れるものの、日本が中国に侵攻したことからソ連へ避難。シベリア横断鉄道経由でソ連・欧州を横断。
- 1938年にイギリスに入国して電気工学を修める。
- 第二次世界大戦が勃発すると、フィリップスは英国空軍に入隊し、シンガポールへ配属された。
- シンガポールが陥落した時、彼は軍隊輸送船エンパイアステートで避難したが、その船はジャワ島へ無事に着く前に攻撃を受けた。ジャワ島もまた日本軍に占領されると、フィリップスは日本軍に捕らえられ、インドネシアの収容所で3年半、捕虜として抑留された。この間、彼は他の捕虜から中国語を学び、秘密ラジオを修理・小型化し、またお茶のための秘密湯沸し器を作り、収容所の照明装置に吊るした。
- 1946年、彼は軍功により大英帝国勲章を受けた。
- 戦後、彼はロンドンへ移り、LSEで社会学を学び始めた。これは戦争捕虜たちが彼ら自身を組織する能力に魅せられたためである。
- しかし彼は社会学の勉強に飽きるようになり、ケインズ理論に興味を覚えて、経済学に転向した。
- フィリップスは1949年に初めてLSEの主要な経済学者等にMONIACを披露したところ大変好意的に受け取られ、フィリップスは間もなくLSEの教職を得ることとなった。
- 1951年、彼は補助講師となり、1958年に教授へと昇進した。
- 1967年にオーストラリアへ戻ってオーストラリア国立大学の教授となり、時間の半分を中国の研究に費やした。
- 1969年に、戦争の後遺症と喫煙の影響が現れた。彼は発作に襲われ、早期退職せざるをえなかった。
- 彼はニュージーランドのオークランドに戻り、1975年3月に死去した。
業績

彼の考案したMONIAC装置と

MONIAC
MONIAC
- フィリップスがLSEの学生だった頃、彼はイギリス経済の動きをモデル化するために、水力を用いたアナログコンピュータを開発した。これは「貨幣的国民所得自動計算機」(Monetary National Income Automatic Computer, MONIAC)と呼ばれたが、恐らくはアメリカのENIACコンピュータを思わせるバクロニムである。そのタンクとパイプを通る水の流れは正確に経済を巡る貨幣の流れを模していた。税率や利子率といった経済変数の捕らえ難い相互作用をモデル化するMONIACコンピュータの能力は、当時としては強力な道具となった。フィリップスは1949年に初めてLSEの主要な経済学者等にMONIACを披露したところ大変好意的に受け取られ、フィリップスは間もなくLSEの教職を得ることとなった。彼は1951年補助講師から1958年教授へと昇進した。
フィリップス曲線
- 彼は研究はイギリスのデータに焦点を当て、失業率が高い年は賃金率は安定しているか、あるいは下落する傾向を観察した。逆に、失業率が低い時は、賃金率は急激に上昇した。この種の傾向は既にアーヴィング・フィッシャーによって確認されていたが、1958年にフィリップスはフィリップス曲線によって描かれるインフレーションと失業との間の関係についての彼自身の研究を出版した。
- フィリップスの論文が出版されると間もなく、強い経済と低いインフレーションとの間にトレード・オフの関係があるという着想は、学究的経済学者や政策立案者に等しく想像力を引き起こした。ポール・サミュエルソンやロバート・ソローは、アメリカの経済状況下でフィリップス曲線に示唆された可能性について述べた重要な論文を書いた。人々がフィリップス曲線と考えるものは時間とともに実質的に変化してはいるものの、依然として景気変動のマクロ経済分析の重要な特徴である。
その他の貢献
- フィリップスはいくつか他にも経済学への、特に安定化政策に関する注目すべき貢献を行った。経済学へのこのアプローチが彼のエンジニアとしての初期の訓練を反映していることは、異なる部門間の取引の流れを表現するためにパイプと巡回する水を備えた経済の物理モデルを構築したことでも明らかである。
著作
- "Mechanical Models in Economic Dynamics", 1950, Economica
- "Stabilization Policy in a Closed Economy", 1954, EJ
- "Some notes on the estimation of time-forms of reactions in interdependent dynamic systems", 1956, Economica
- "Stabilisation policy and the time form of lagged response", 1957, EJ
- "The Relation Between Unemployment and the Rate of Change of Money Wage Rates in the United Kingdom, 1861-1957", 1958, Economica
- "The Estimation of Parameters in Systems of Stochastic Differential Equations", 1959, Biometrika
- "Employment, Inflation and Growth", 1962, Economica
- "Estimation of Systems of Difference Equations with Moving Average Disturbances", 1966, Econometrica
MONIAC - Wikipedia
https://en.wikipedia.org/wiki/MONIAC
The MONIAC (Monetary National Income Analogue Computer) also known as the Phillips Hydraulic Computerand the Financephalograph, was created in 1949 by the New Zealand economist Bill Phillips (William Phillips) to model the national economic processes of the United Kingdom, while Phillips was a student at the London School of Economics (LSE). The MONIAC was an analogue computer which used fluidic logic to model the workings of an economy. The MONIAC name may have been suggested by an association of money and ENIAC, an early electronic digital computer.
Description

MONIAC dashboard
The MONIAC was approximately 2 m high, 1.2 m wide and almost 1 m deep, and consisted of a series of transparent plastic tanks and pipes which were fastened to a wooden board. Each tank represented some aspect of the UK national economy and the flow of money around the economy was illustrated by coloured water. At the top of the board was a large tank called the treasury. Water (representing money) flowed from the treasury to other tanks representing the various ways in which a country could spend its money. For example, there were tanks for health and education. To increase spending on health care a tap could be opened to drain water from the treasury to the tank which represented health spending. Water then ran further down the model to other tanks, representing other interactions in the economy. Water could be pumped back to the treasury from some of the tanks to represent taxation. Changes in tax rates were modeled by increasing or decreasing pumping speeds.
Savings reduce the funds available to consumers and investment income increases those funds.[citation needed] The MONIAC showed this by draining water (savings) from the expenditure stream and by injecting water (investment income) into that stream. When the savings flow exceeds the investment flow, the level of water in the savings and investment tank (the surplus-balances tank) would rise to reflect the accumulated balance. When the investment flow exceeds the savings flow for any length of time, the surplus-balances tank would run dry. Import and export were represented by water draining from the model, and by additional water being poured into the model.
The actual flow of the water was automatically controlled through a series of floats, counterweights, electrodes and cords. When the level of water reached a certain level in a tank, pumps and drains would be activated. To their surprise, Phillips and his associate Walter Newlyn found that MONIAC could be calibrated to an accuracy of ±2%.
The flow of water between the tanks was determined by economic principles and the settings for various parameters. Different economic parameters, such as tax rates and investment rates, could be entered by setting the valves which controlled the flow of water about the computer. Users could experiment with different settings and note the effect on the model. The MONIAC’s ability to model the subtle interaction of a number of variables made it a powerful tool for its time.[citation needed] When a set of parameters resulted in a viable economy the model would stabilise and the results could be read from scales. The output from the computer could also be sent to a rudimentary plotter.
MONIAC had been designed to be used as a teaching aid but was discovered also to be an effective economic simulator.[citation needed] At the time that MONIAC was created, electronic digital computers that could run complex economic simulations were unavailable. In 1949, the few computers in existence were restricted to government and military use. Neither did they have adequate visual display facilities, so were unable to illustrate the operation of complex models. Observing the MONIAC in operation made it much easier for students to understand the interrelated processes of a national economy. The range of organisations that acquired a MONIAC showed that it was used in both capacities.
Phillips scrounged a variety of materials to create his prototype computer, including bits and pieces from war surplus such as parts from old Lancaster bombers. The first MONIAC was created in his landlady’s garage in Croydon at a cost of £400 (equivalent to £13,000 in 2015).
Phillips first demonstrated the MONIAC to a number of leading economists at the LSE in 1949. It was very well received and Phillips was soon offered a teaching position at the LSE.
Current locations
It is thought that twelve to fourteen machines were built.
- The prototype was given to the Economics Department at the University of Leeds, where it is currently on exhibition in the reception of the university's Business School. Copies went to three other British universities.
- Other computers went to Harvard Business School and the Roosevelt College in the United States, and Melbourne University in Australia. The Ford Motor Company and the Central Bank of Guatemala are believed to have bought MONIACs.
- A MONIAC owned by Istanbul University is located in the Faculty Of Economics and can be inspected by interested parties.
- A MONIAC from the LSE was given to the Science Museum in London and, after conservation, was placed on public display [1] in the museum’s mathematics galleries.
- A MONIAC owned by the LSE was donated to the New Zealand Institute of Economic Research in Wellington, New Zealand. This machine formed part of the New Zealand Exhibition at the Venice Biennale in 2003. The MONIAC was set to model the New Zealand economy. In 2007 this machine was restored and placed on permanent display in the Reserve Bank of New Zealand Museum.[1]
- A working MONIAC (or Phillips Machine as it is known in the UK) can be found at the Faculty of Economics and Politics at Cambridge University in the United Kingdom. This machine was restored by Allan McRobie of the Cambridge University Engineering Department, who holds an annual demonstration to students.
- A replica of the MONIAC at the central bank of Guatemala was created for a 2005-6 exhibition entitled "Tropical Economies" at the Wattis Institute of the California College of the Arts in San Francisco.[2]
- The MONIAC at The University of Melbourne, Australia, is on permanent display in the lobby of the Giblin Eunson Library (1st Floor, Business and Economics Building, 111 Barry st, Carlton, Melbourne). The faculty has extended an invitation to anyone interested in restoring the MONIAC to functional capacity.
- Erasmus University Rotterdam (EUR) has owned a MONIAC since 1953. It was a gift from the City of Rotterdam for EUR's 40th anniversary. It is located in the THEIL building on the B floor next room CB-1.
Popular culture
- The Terry Pratchett novel Making Money contains a similar device as a major plot point. However, after this device is fully perfected, it magically gains the ability not only to simulate the economy but to affect it, culminating in a scene where it refills a bank's gold reserve.
See also
References
- ^ "A. W. H.(Bill) Phillips, MBE and the MONIAC" (PDF). Archived from the original (PDF)on 12 August 2013. Retrieved 28 November 2012.
- ^ "Michael Stevenson: Tropical Economies". Retrieved 28 November 2012.
Hally, Mike (2005), Electronic Brains: Stories from the Dawn of the Computer Age, Joseph Henry Press, pp. 187–205, ISBN 0-309-09630-8.
Documentary
- "The League of Gentlemen". Third Episode of Pandora's Box, a documentary produced by Adam Curtis
External links
| Wikimedia Commons has media related to MONIAC. |
- BBC Radio Four programme 'Water on the brain'.
- NZIER's Moniac Machine Article includes picture of NZIER Moniac
- Inc. article: When Money Flowed Like Water
- Wetware article: Money Flows: Bill Phillips' Financephalograph
- enginuity article
- RESURRECTION The Bulletin of the Computer Conservation Society Number 12 Summer 1995
- Copy of Fortune 1952 article with both a picture and illustration of Moniac
- A great disappearing act: the electronic analogue computer Chris Bissell, The Open University, Milton Keynes, UK. Presented at IEEE Conference on the History of Electronics, Bletchley Park, UK, 28–30 June 2004. Moniac on pages 6 and 7. Accessed February 2007
- Catalogue of the AWH Phillips papers at the Archives Division of the London School of Economics.
- Tim Ng and Matthew Wright. - Introducing the MONIAC: an early and innovative economic model, in, Reserve Bank of New Zealand bulletin, v. 70, no. 4 December 2007 [2]
- Video of the Phillips Machine in operation Allan McRobie demonstrates the Phillips Machine at Cambridge University and performs calculations. (A lecture given in 2010).
- Business Cycles in the Phillips Machine Paper presented at the ASSRU, Trento, Italy, 2011. Contains detailed diagrams of the Machine workings
- The Phillips Machine Article includes links to videos of the machine in operation.[dead link]
- Like Water for Money Article by Steven Strogatz in the New York Times that talks about MONIAC
- LSE Photo of Phillips with the machine
- Bill Phillips Lecture by Alan Bollard, 16 July 2008
水をくみ上げ、経済情勢をシミュレートし、未来を予測する、1949年製のコンピューター「MONIAC」|WIRED.jp
http://wired.jp/2014/12/05/moniac/水をくみ上げ、経済情勢をシミュレートし、未来を予測する、1949年製のコンピューター「MONIAC」
1949年に作製された、水を用いて経済データを分析するコンピューター「MONIAC」。デモンストレーションを動画で紹介。
TEXT BY KLINT FINLEY
TRANSLATION BY SATOMI FUJIWARA/GALILEO
WIRED NEWS (US)
TRANSLATION BY SATOMI FUJIWARA/GALILEO
WIRED NEWS (US)

上の動画は、先頃行われた1949年製コンピューター「MONIAC」のデモンストレーションの様子だ。
MONIACとは、Monetary National Income Analogue Computer(貨幣的国民所得自動計算機)の略で、水を使って経済を分析するための機械だ。パイプやタンクを通じて水をくみ上げ、経済情勢をシミュレートし、未来を予測しようというものだ。
「ルーブ・ゴールドバーグ・マシン」を思い出させるような、高さ2mを超えるこの仕掛けは、経済分野の計算をさせるには奇妙な方法のように見えるかもしれない。特に、当時の計算機でもそうしたタスクは処理できたはずだと考えれば(1946年には米陸軍がENIACを発表しているが、それ以前にも機械式計算機はいくつか開発されている)。
だが、コンピューターの歴史に詳しいドロン・スウェイドが『Inc.』誌の記事で説明しているとおり、これを考案したアルバン・ウィリアム・フィリップス(ニュージーランド生まれで英国などで研究生活を送った経済学者)は、コンピューターにモニターがなかった時代に、経済を視覚化する方法を探していたのだ。
Making Money Flow: The MONIAC
ニュージーランド準備銀行博物館にあるMONIACの紹介動画。
たくさんのタンクや水の流れは、銀行、消費者支出、個人貯蓄、外貨準備など、経済活動のさまざまな側面を表している。マクロビー教授が説明しているように、個人貯蓄のタンクが一杯になろうとしていて、より多くの投資を奨励したいとしたら、システム全体により自由にお金(水)が流れるように、銀行のタンクのところにあるヴァルヴを緩めることで利率を下げる。
MONIACは全部で14台しかつくられていない。そのほとんどは、世界中の大学の地下室で朽ち果てようとしているが、まだ機能するものが少なくとも2台ある。そのうちの1台は、ニュージーランド準備銀行(Reserve Bank)付属の博物館にあり、もう1台は英国のケンブリッジ大学にある。
上の動画は、ケンブリッジ大学で行われたMONIACのデモンストレーションの一部だ。同大学で眠っていたMONIACを、アラン・マクロビー教授(工学)が2009年に修復した。
YouTubeでは、MONIACのシミュレーションをソフトウェアで再現した動画も見られる。ただし、水を使わないと、それほど面白くない。
フィリップスは明らかにフィッシャーの影響を受けている。
Phillips' Economic "MONIAC Hydraulic Computer" — Dr. Marcus Schütz


The Reserve Bank Museum | Activities | The Moniac | Introduction

サミュエルソンとソローが賃金上昇率を物価に置き換えたというがフィッシャーはすでに物価を変数としていた
返信削除
返信削除The American Economic Review
JOURNAL ARTICLE
Analytical Aspects of Anti-Inflation Policy
Paul A. Samuelson and Robert M. Solow
The American Economic Review
Vol. 50, No. 2, Papers and Proceedings of the Seventy-second Annual Meeting of the American Economic Association (May, 1960), pp. 177-194
Published by: American Economic Association
https://www.jstor.org/stable/1815021
清家労働112
https://www.bloomberg.com/news/articles/2017-08-24/phillips-curve-doesn-t-help-forecast-inflation-fed-study-finds
返信削除Markets
Phillips Curve Doesn't Help Forecast Inflation, Fed Study Finds
By Matthew Boesler
2017年8月25日 4:46 JST
Paper co-authored by top-ranking Philadelphia Fed economist
Findings offer ‘no evidence for relying on the Phillips curve’
Why the Phillips Curve Is Key for Fed's Inflation Target
Unmute
Why the Phillips Curve Is Key for Fed's Inflation Target
A fundamental relationship of mainstream economic theory at the heart of the Federal Reserve’s strategy for setting interest rates has been a poor guide for policy makers for at least three decades, according to a study by the Philadelphia Fed’s top-ranking economist.
The paper, co-authored by Philadelphia Fed Director of Research Michael Dotsey, shows that forecasting models based on the so-called Phillips curve, which asserts a link between unemployment and inflation, don’t actually help predict inflation.
To continue reading this article, you must be a Bloomberg News subscriber.
https://www.bloomberg.com/news/articles/2017-08-24/phillips-curve-doesn-t-help-forecast-inflation-fed-study-finds
市場
フィリップスカーブはインフレの予測を助けない、FRBの調査結果
著マシューBoesler
2017年8月25日4:46 JST
トップランクのフィラデルフィア連盟エコノミストによる共著論文
調査結果は「フィリップス曲線に頼っているという証拠はない」
なぜフィリップス曲線がFRBのインフレ目標にとって重要なのか
ミュートを解除
なぜフィリップス曲線がFRBのインフレ目標にとって重要なのか
フィラデルフィア連銀のトップエコノミストによる研究によると、金利設定のための連邦準備制度理事会の戦略の中心にある主流の経済理論の基本的な関係は、政策立案者にとって不十分な指針であった。
フィラデルフィア連銀のリサーチディレクターMichael Dotseyが共著したこの論文は、失業とインフレの関連性を示唆するいわゆるフィリップス曲線に基づく予測モデルは、実際にはインフレの予測には役立たないことを示しています。
この記事を読み続けるには、ブルームバーグニュースの購読者である必要があります。
フィリップスカーブは1926年にフィッシャーが発見した
返信削除Fisher, Irving. “A Statistical Relation between Unemployment and Price Changes.” International Labour Review 13 (June 1926) : 785-92.
[失業と物価変化の統計的関係]
以下は英文でフィリップスカーブの歴史考察論文
https://www.richmondfed.org/~/media/richmondfedorg/publications/research/economic_review/1985/pdf/er710502.pdf
フィリップスは水圧で動くマルクス経済表?みたいなものを作っている
瀧澤弘和 現代経済学 2018/8 中公新書でも紹介されていたフィリップス制作のマクロ経済学モデル
Making Money Flow: The MONIAC
https://youtu.be/rAZavOcEnLg
ただしこれはマルクスではなくフィッシャーからの影響
フィッシャーは水を使った経済モデル機械を実際に作っている
https://lh3.googleusercontent.com/-4zmY2nwOV1Q/WRrb1Yvl6YI/AAAAAAABOkc/U81eMmolX7QRlY9tHC_f4FpSjoebEGH0wCHM/s640/blogger-image-874804736.jpg
こういう試行錯誤と交換方程式(貨幣数量説) MV = PT (1911年)が繋がっている
水は重さがあるから最近のマネタリズムと違って実体を把握しようというベクトルがより現実的
Tは鉄何トンというような実質取引量
参考:
返信削除マルクス経済表
再生産表式と部門1,2が逆
https://lh5.googleusercontent.com/-ut-d_q2KJ84/U2ZHzhs0VfI/AAAAAAAAdxE/vWBXOR3y2xo/s640/blogger-image-148496617.jpg
https://lh6.googleusercontent.com/-tVWXJzHyywg/U2ZHujpJMbI/AAAAAAAAdw8/dfu6DzXbqVE/s640/blogger-image-2016139846.jpg
フィリップスカーブは1926年にフィッシャーが発見した
返信削除Fisher, Irving. “A Statistical Relation between Unemployment and Price Changes.” International Labour Review 13 (June 1926) : 785-92.
[失業と物価変化の統計的関係]
以下は英文でフィリップスカーブの歴史考察論文
https://www.richmondfed.org/~/media/richmondfedorg/publications/research/economic_review/1985/pdf/er710502.pdf
フィリップスは水圧で動くマルクス経済表?みたいなものを作っている
瀧澤弘和 現代経済学 2018/8 中公新書でも紹介されていたフィリップス制作のマクロ経済学モデル
Making Money Flow: The MONIAC
https://youtu.be/rAZavOcEnLg
ただしこれもマルクスではなくフィッシャーからの影響
フィッシャーは水を使った経済モデル機械を実際に作っている
https://lh3.googleusercontent.com/-4zmY2nwOV1Q/WRrb1Yvl6YI/AAAAAAABOkc/U81eMmolX7QRlY9tHC_f4FpSjoebEGH0wCHM/s640/blogger-image-874804736.jpg
こういう試行錯誤と交換方程式(貨幣数量説) MV = PT (1911年)が繋がっている
水は重さがあるから最近のマネタリズムと違って実体を把握しようというベクトルがより現実的
Tは鉄何トンというような実質取引量
参考:
マルクス経済表
再生産表式と部門1,2が逆
https://lh5.googleusercontent.com/-ut-d_q2KJ84/U2ZHzhs0VfI/AAAAAAAAdxE/vWBXOR3y2xo/s640/blogger-image-148496617.jpg
https://lh6.googleusercontent.com/-tVWXJzHyywg/U2ZHujpJMbI/AAAAAAAAdw8/dfu6DzXbqVE/s640/blogger-image-2016139846.jpg