日曜日, 6月 30, 2019

#10 balance sheet By Eric Tymoigne 転載


#10:152~(#21:339)☆☆


#10:154 Karl Brunner,1916~

https://cruel.org/econthought/profiles/brunner.html

"The Role of Money and Monetary Policy", 1968, St. Louis Fed Review

https://files.stlouisfed.org/files/htdocs/publications/review/68/07/Money_July1968.pdf


 ミッチェル2019(ラーナー機能的財政の基本的な諸関係を改変): 内に全ての要素がある

             ______
            |      |
            |  政策  |[]20~24
            |______| A 
         ___|________
        /            \
       /              \[]17~19 
      /      E非雇用      \
     /        /雇用       \ A 
    /____________________\
    |         Y所得        |[]11~16
    |____________________|A
    |   | |      I投資     |  15.5
    |C(Y) |______________| 
    |消費 | |I(i)  | i利子率  |  12.5,25.5
    |性向 | |投資 |  |_______|  
    |   | |機会 |  |i | |M |[] 9~10
    |___| |___| (M,Y) |貨幣|A 
     A  A]  流動性選好 
          25~26   /   
     A          
   歴史[]1~8,[]27~30,[]31~33現状,未来
#4:59 CPI:消費者物価指数、#5:69雇用非雇用分類(労働力の構成)、#12:190(#29:481)流動性選好、#17:262交換方程式、#19:31 JG:雇用保証、#25:403 複利、#28:445,454 IS-LM
  , , , , , , , 
  10
 1112131415 ,16 
 171819 
 2021222324 
 2526
 272829
30
 313233


#10,10,13,1


ティモワーニュ

以下の4の和訳

https://drive.google.com/file/d/0Bz2V1zKzg0azQ0ZJZS03aXlWSHc/view

https://blog.goo.ne.jp/wankonyankoricky/e/a2d05b9a470b8fb7b70f6bcb3d17e3e3


10

https://drive.google.com/file/d/0Bz2V1zKzg0azM1J4cGtEclR6WUU/view

https://blog.goo.ne.jp/wankonyankoricky/e/0d6e3913edff001ef9167f1aa4ff9ad2/?cid=1d79c15d5a6bd773155959cd4bbb6d46&st=0


13a

https://drive.google.com/file/d/0Bz2V1zKzg0azQWFmNnRoNkRfZnc/view

https://blog.goo.ne.jp/wankonyankoricky/e/7a267d930dd3067e89f9a5ab921599d6/?cid=1d79c15d5a6bd773155959cd4bbb6d46&st=0

13b☆


https://blog.goo.ne.jp/wankonyankoricky/c/1d79c15d5a6bd773155959cd4bbb6d46/4


☆ 

貨幣と銀行業務 Part13 続き

17/02/14 20:53

えっと、

HTMLだと1回に納まりきらなかったので

続きです。(PDFのほうは、

全部おさまっているし、グラフもちゃんとついているので

可能な方はそちらをご覧いただくほうがいいんですけど。。。)

(以下、本文)

3.公的債務と国内民間純資産

公的債務とは合衆国財務省証券(USTS)の残高のことである。ここには市場性の高いもの(T-bills[(米国財務省短期証券):数日~52週間の割引債]、T-notes[(米国財務省中期証券):2・3・5・7・10年物の利付債]、T-bonds[(米国財務省長期証券):30年物の利付債]、TIPSs[合衆国物価連動国債]、その他にも2・3種類)と市場性のない証券(米国債、金証券、米国貯蓄債券、州政府・地方政府の要求払い預金、預金ファンドに保有されているあらゆる種類の政府系証券)とが含まれる。

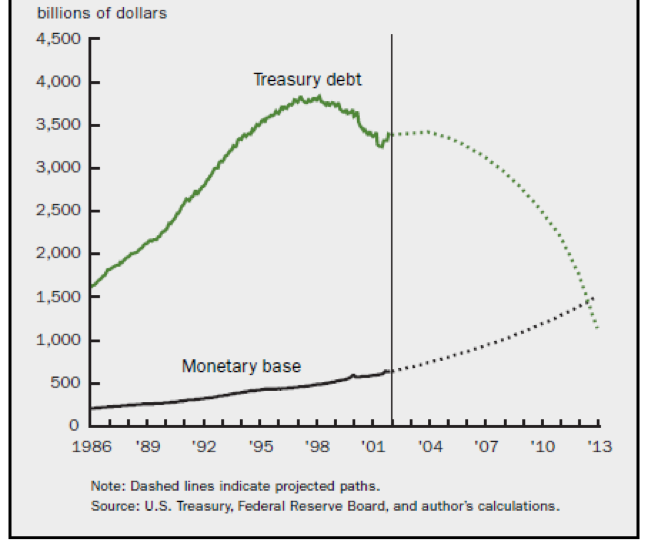
2000年代初頭、財政黒字は継続し、さらに大きくなってゆくだろう、と期待されていた。グラフ3は公的債務とマネタリーベースの成長が当時どのように予想されていたかを示したものである。公的債務のこのようなトレンドは何を意味するだろうか。

Figure 3 Public debt and monetary base.
Source: Marshall 2002 

分析を単純にするため以下の仮定を置こう。1- 政府部門には連邦財務省と中央銀行だけを含む。2- 政府の負債は財務省証券だけとする(中央銀行の未償還残高はない)。3- 閉鎖経済(外国部門はない)。4- バランスシートは以下の通り。

AG

LG

 FAG (未収税金)

$50

FLG(財務省証券)

$100

RAG

$1150

NWG

$1100

ADP

LDP

 FADP (財務省証券)

$100

FLG(未払税金)

$50

RADP

$350

NWDP

$400

さて、財務省は負債をすべてなくしたいと望んでいる。公的負債はもうやめる!これは何を意味しているだろうか。

  • ケース1:財務省証券が満期になっても、保有者に償還しない:すなわち元本に100%の税をかける。⇒FADP = 0。国内民間部門はそのすべての金融資産を失う。

ADP

LDP

 FADP (財務省証券)

$0

FLG(未払税金)

$50

RADP

$350

NWDP

$300

  • ケース2:財務省の負債とは考えられない金融商品(例えば鋳貨はFASAB[連邦会計基準諮問委員会]では、エクイティーとして取り扱われている)へと切り替える。

ADP

LDP

 FADP (鋳貨)

$100

FLDP(未払税金)

$50

RADP

$350

NWDP

$400

AG

LG

 FAG (未収税金)

$50

FLG

$0

RAG

$1150

NWG

$1200

  • ケース3:公的負債に含まれない政府の他の負債と切り替える。連邦準備局の負債で償還する。

ADP

LDP

 FADP (準備)

$100

FLDP(未払税金)

$50

RADP

$350

NWDP

$400

AG

LG

 FAG (未収税金)

$50

FL(準備)G

$0

RAG

$1150

NWG

$1200

これらすべての場合で国内民間部門には決定的な影響が生じている。というのはこれらいずれも民間のバランスシートからデフォルトリスクフリーの流動的な利付きの証券――財務省証券――がなくなってしまっているからである。財務省証券は不可欠である。国内民間部門に富を創り出し、資本基準に適合することを可能にし、安全な方法で金利収入を獲得し、そして中央銀行の再融資を受けることを可能にしているのである。従って、公的債務を償還する、という意見に賛成するときには、そう言うことでいったい自分が何を望んでいることになるのか、よくよく考えてもらいたい。

4.景気循環とセクター間バランス

三部門バランスの相互関係を見るだけで、景気循環を部分的に理解することができる。第一に、通常、三部門すべてが黒字になろうと望むということもあるだろう。

  • 国内民間部門は破産を避けるために黒字であることが必要だ。
  • 州政府・地方政府は破産を避けるため黒字であることが必要だ。
  • 連邦政府は
    • 政府が他の国内部門同様財政に責任を持っている、ということを示すために黒字になろうとする。
    • 自動安定化機能により、経済が拡張している時期には黒字傾向になる。
  • 外国部門は、政治的および金融安定上の理由で黒字を達成する必要がある。

勿論、実際にこれらすべてが同時に黒字になることは不可能だ。しかしそれぞれの部門とも通常は同時に黒字であることを欲している。

非政府部門(NGとして、DPとFを連結したものとする)が希望通りの黒字(NGBd)になっている状態から始めよう。

  • ステップ1:NGB = NGBd > 0となっている成長経済:非政府部門は望み通りの純貯蓄をしている。この場合、GB < 0でなければならず、政府は赤字である。
  • ステップ2:政府部門が黒字を望んでいる(GBd > 0)成長経済。成長経済では、自動安定化機能により政府赤字が小さくなるので、これは政府の望み通り。しかし、政府が黒字へ復帰するペースがまだ遅すぎる、ということになると、緊縮政策が採用され、課税(T)引上と/または支出(G) 切下が行われ(「国家はその持てるものの範囲で生きていかねばならない」)、自動安定化機能効果が強化される。というわけで、∆GB > 0 従って、 ∆NGB < 0
  • ステップ3:NGB < NGBd この場合、非政府部門が純金融蓄積する方法は、
    • DPB < DPBd の場合:消費と投資が低下
    • FB < FBdの場合:輸出が減少(外国から見て輸入が減少)
  • ステップ4:非政府部門の支出(C、I、X)減少が政府支出(G)の減少と同時に怒ると、集計的所得の低下につながる(GDP = C + I + G + NX)。集計所得が低下したことでGは自動的に上昇し、Tが自動的に低下する。政府の収支バランスは悪化する(∆GB < 0)。所得は安定する。
  • ステップ5:政府の財政悪化によって非政府部門の収支バランンスが改善す(∆NGB > 0)。これはNGB = NGBdになるまで続く。ステップ1に戻る。

短期的に定常状態(つまり、集計所得が変化しない状態)になるには二つの道しかない。

  • 第1の道:GBd がマイナスになる、つまり、政府部門が赤字になり、この赤字が均衡赤字水準(GB*)になる。均衡赤字水準とは、非政府部門にとって望ましいと考えられている純貯蓄水準と整合する水準である。つまりGB* = NGBd。これは貨幣主権性のある政府にとっては現実的な解決策であるが、政治家は恒久的な財政赤字を主張するのはいやがるものだ。一般国民や政治家、ほとんどのエコノミストには貨幣主権性のある政府がどのようにオペレーションしているのか理解されていないからである。破産、インフレの加速、債務監視団といったものがすぐ持ち出されるが、実際には何の関係もない。
  • 第2の道:NGBd をマイナスにする。
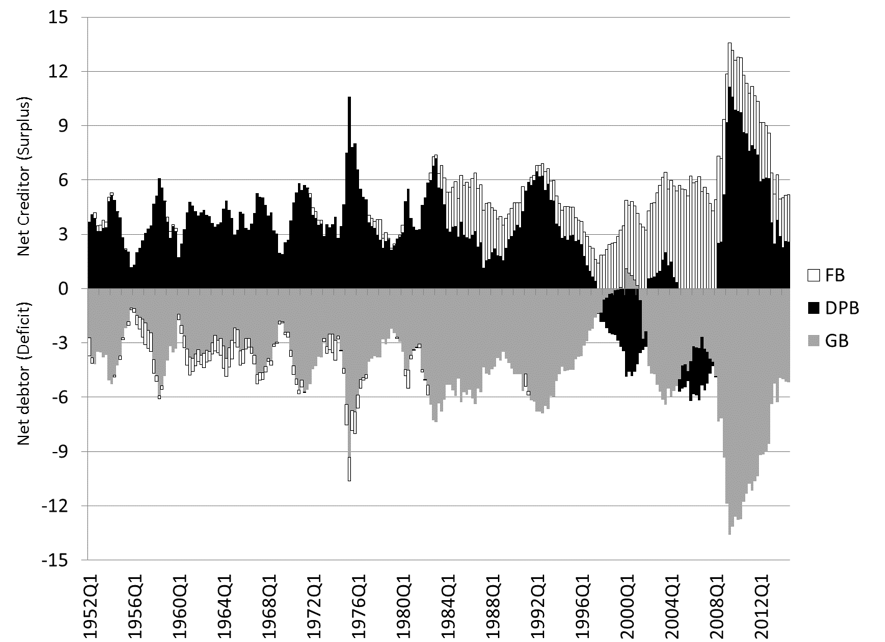
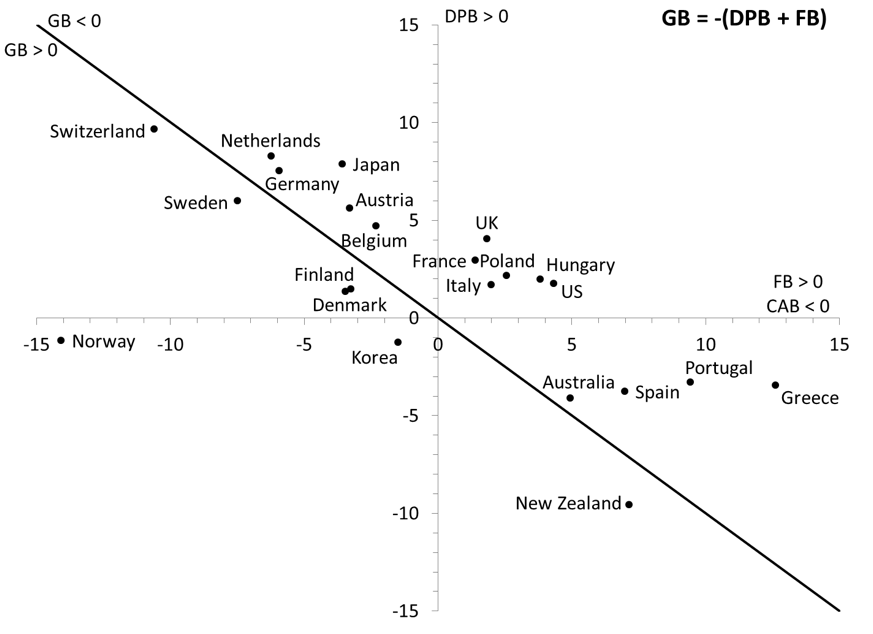
    • DPBd をマイナスにする。これは実際に1990年代後半から2000年代初頭にかけて合衆国で生じたことである(図1)。この場合にはGB>0が可能である。オーストラリア、韓国、ニュージーランド、およびいくつかのヨーロッパの国々では国内民間部門の収支残高がマイナスになっている。(図2a、2b)しかし、国内民間部門の赤字は持続不可能である。これは最終的にはポンツイ金融になることを意味しているからである(Post 14 参照)。
    • FBd がマイナス(外国人の収支が望ましい水準までマイナスになる、ということはつまり、経常収支がプラスになり、それが政府部門および国内民間部門で望ましい水準の貯蓄を生み出すのに十分な大きさ、ということ):経常収支黒字(海外部門マイナス収支)を外国部門に受け入れてもらうことが可能なのは、一つには、その国が発展途上国である場合。今一つは、その国が対外的な準備通貨の支払いができるためには対外経常収支が黒字になっていなければならないことを、諸外国が理解している場合である。

ただし

  • もしある国が世界の他の国々に対して赤字支出[海外部門黒字]を継続することが必要なら、国内民間部門か政府部門、またはその両方が赤字であり続けることになる。もし赤字になるのが国内民間部門なら不安定[持続不可能]であろうし、赤字が政府部門なら、その債務がどの国の通貨であるかによって、安定かどうか決まる(国内通貨建なら問題ない)。
  • 国債準備通貨供給国の場合、国内CABがマイナスだとしても、通貨が不換性なら持続可能である。通貨が兌換制なら、トリフィンのジレンマが当てはまる。このジレンマは次のようなものだ。ある国が世界中の他の国々に対して自国通貨を供給するためには経常赤字でなければならないが、諸外国の手持準備残高が増加するとともに、交換要求の脅威に直面する、ということだ。


結論

マクロ経済部門間方程式によって、望ましいとされているものの中には両立しえないもの或いは極端に達成の難しいものがあることが示される。従って、経済的調整――評価引き下げ、金利の変更、集計的所得の変動その他もろもろ――がどれほどなされようと、ある願望は決して達成されることなく、そしてその両立不可能な願望を目標とする政策を継続すれば、恐ろしく破壊的な結果になる。会計的ルールに従って両立可能な政策目標や願望を設定することが最も良い。そして以下のことに留意しなくてはならない。

  • 誰かの黒字は誰かの赤字
  • 誰かの貯蓄は誰かの貯蓄取崩し
  • 誰かの輸出は誰かの輸入
  • 誰かの支出は誰かの収入
  • 誰かの金融資産は誰かの負債
  • 誰かの預金負債は誰かの預金資産

会計的ルールを貨幣システムが機能しているあり方から和えられた洞察と結びつけることができる。そこから重要な結論がいくつか導き出される。

  • 国内民間部門が純債務になることは避けるべきだ:金融不安定性に結びつく(ブログ 14)。
  • 貨幣的主権を有する連邦政府は、通常、赤字であることが必要になる(国内勘定が収支均衡しない限り)。貨幣主権政府はその計算単位建の負債を常に償還できるのである。
  • 国によっては純輸入国であることが必要だ。
    • 経済発展が遅れており資源が乏しい場合。この場合、民間融資ではなく外国による支援こそが取られるべき道だ。
    • 国際通貨の供給国である場合(今日の合衆国)。この場合、世界の他の国々がその通貨の純貯蓄国になろうと欲しているのであり、その通貨供給国は経常赤字にならざるを得ない。
  • 純輸入国になることが必要な国がある限り、どこかの国が純輸出国になる。蓄積速度が速すぎる場合、時間とともに債務を清算して金利を成長率と比較して低めに設定することが必要となる。

国民所得生産統計勘定の立場から見たセクター間バランス

集計的水準で見ると、商務省経済分析局が管理している国民所得生産統計勘定(NIPA)ではすべての種類の財・サービスの経済活動を記録している。NIPAは国内総生産(GDP) への支出アプローチでは会計的手法が取られている。

GDP ≡ C + I + G + NX

国内総生産は財・サービスの全最終支出を合計したもので、ここには国内民間最終消費(C)、国内民間投資(I)、財・サービスへの政府支出(G)、そして純輸出(NX)が含まれている。我々はGDPに対する所得アプローチも会計的手法に従っていることを知っている。

GDP ≡ YD + T

すなわち、軽微な不一致があるとしても、国内総生産と国内の所得総額あるいは、別の言い方をすると、国内の可処分所得(YD)――賃金、利潤、利息、賃貸料――及び所得及び生産に対する税金全体(純移転所得)(T)を合計したものは一致する。

つまり:

YD + T ≡ C + I + G + NX

さらに、国際的な所得源の統計勘定口、合衆国国際取引統計勘定(USITA)[※定訳語なし?日本の国際収支勘定と同じ?](この統計勘定は、合衆国とそれ以外の国々との関係を示す)に従うなら:

CABUS ≡ NX + NRA

経常収支バランスは、貿易収支(純輸出)と海外純所得(NRA)(移転収支差引後)の合計である。

NIPAとUSITAを足し合わせ、海外所得に課せられる租税Tを加えると(NRAD は海外からの可処分所得である)、以下の式を得る。

YD + NRAD + T ≡ C + I + G + CABUS

さらに、NIPAでは、集計的貯蓄(S)は可処分所得と消費の差額と定義されるので、S ≡ YD + NRAD – C、 というわけで、

(S – I) + (T – G) – CABUS ≡ 0

または、すべての純輸出者に対しては純輸入者がいるのだから(CABF = -CABUS):

(S – I) + (T – G) + CABF ≡ 0

この最後の式は、金融統計勘定から得られたものと大体同じである。違っているのは、これがGDPから導出されたものであること、それゆえ、当期生産物(つまり、新しく生産された財・サービス[※通常は「経常生産物」と訳されることが多いが、それだと意味が分からないので、「当期生産物」とした])しか取り扱っていない、ということである。


NIPAFAにおける貯蓄の定義

国民所得生産統計勘定(NIPA)では貯蓄について金融統計勘定(FA)とは異なる定義を採用している。両者は下記のような特別な状況でしか一致しない。NIPAの貯蓄は、消費されなかった所得として定義されている。例えば、家計の貯蓄は、可処分所得マイナス消費財への支出と定義されている。S = YD – Cである。FAの貯蓄とは、純資産の増加として定義されている。S = ΔNWである。

この違いは、両統計勘定の目的の違いを反映している。NIPAは、分析の核に国内総生産(GDP)をおいて当期の経済活動を測定することに焦点を当てている。例えば、ある国でリンゴを生産し、そのうちいくつかがアップルタルトを生産するために用いられているとしよう。GDPとは直接消費されたリンゴのドル価額と、アップルタルトのドル価額のことである。これが年間の生産物である。NIPAの貯蓄とは、何かに支払われた所得のうち、アップルタルト購入にも直接消費用リンゴの購入にも向けられなかった額である。

FAの射程はもっと広く、その目的はバランスシート[※英語では金融取引残高表のことも「バランス・シート」と呼ぶ]の中で何が起こっているかを測定することである。バランス・シートは当期生産以外にも数多くの物事の影響を受ける。就中、

  1. ここには過去に生産された実物資産が含まれている
  2. ここには金融資産が含まれている
  3. 資産のドル価額を変化させるものには、生産活動や新しい証券を発行することによるストックの変化以外にも、価格の変化(キャピタル・ゲイン/ロス)がある。
  4. 消費財の中には耐久財もある。
  5. バランス・シート上の負債は元本の償還を必要とする。

例えば、家計が何も所有せず、何者にも負っていないとしよう。家計が働き始め、賃金として10ドルを受け取ると、バランス・シート上は

AH

LH

 FAH(銀行預金口座)

$10

NWH

$10

純資産が10ドル増加したのでFAも10ドルに等しいが、何も消費されていないのでNIPAには変化がない。ここで家計が商店に赴き2ドルのリンゴを購入した。それがこの月の唯一の支出だとしたら

AH

LH

 FAH(銀行預金口座)

リンゴ

$8

$2

NWDP

$10

NIPAに従うなら、貯蓄は8ドルであるが、FAは依然として10ドルである。家計がリンゴを食べてしまうと、定義により、同じだけの価額の変化が生じる:

AH

LH

 FAH(銀行預金口座)

$8

NWDP

$8

この場合、差が生じる原因は、NIPAでは消費目的で行われた支出(商店でのリンゴの購入)の額である。バランス・シート上では消費は実物資産の減少額を意味している(リンゴが食べられた)。近年になり、経済分析局では統合マクロ経済統計勘定 Integrated Macroeconomic Accounts を作成している。その目的は上記二つのアプローチを一つの勘定フレームワークに統合することである。ケネス・ボールディングKenneth Bouldingはバランス・シートと整合性のある定義に基づいた包括的なフレームワークを開発した。「支出」(リンゴを買うために資金を使う:実物資産が増加し金融資産が減少する)と「消費」(リンゴを食べる:実物資産を償却する)の間に明確な区別を立てた。経済理論内への展開は、モデルの諸勘定口をそれぞれきちんと結びつけることを目指して行われた。ストックとフローが整合したマクロ経済モデルを構築することによって、そのモデルはモデル内に含まれている諸部門の相互依存関係を全て確実に説明できるものになる。

今日はここまで。次回のテーマは「金融危機」で、そしてその次、最終回「貨幣」へと続くことになる。

[Revised 8/6/2016]

カテゴリー:MMT & SFC

最近の「MMT & SFC」カテゴリー


Money & Banking - New Economic Perspectives

http://neweconomicperspectives.org/money-banking

Money & Banking

The following posts and textbook were written to provide alternative means to understand money and banking issues. While the post have been revised and edited somewhat relative to what was written in the spring, the textbook is a much better document. The textbook uses the posts but thoroughly edited and expanded them; everything is also formatted so that the material is easier to read.

Throughout the material, the concept of balance sheet is central and used to analyze all the topics presented. Not only are balance sheets relevant to understand financial mechanics, but also they force an inquirer to fit a logical argument into double-entry accounting rules. This is crucial because if that cannot be done there is an error in the logical argument.

The monetary and banking aspects and their relation to the macroeconomy are analyzed extensively in this material by relying on the literature that has been available for decades in non-mainstream journals, but that has been mostly ignored until recently. Gone is the money multiplier theory, gone in the financial intermediary theory of banks, gone is the idea that central bank control monetary aggregates, gone is the idea that finance is neutral in any range of time, and gone is the idea that nominal values are irrelevant. Preoccupations about monetary gains, solvency and liquidity are central to the dynamics of capitalism, and finance is not constrained by the amount of saving.

The posts dealing with monetary systems are also much more developed than a typical textbook and integrated with the rest of the material. As such, the “money” chapter, usually first in M&B texts, only comes much later in the form of three chapters, once balance-sheet mechanics and financial concepts, such as present value, have been well understood. In addition, the link between macroeconomic topics and banking theory is fully established to analyze issue of inflation, economic growth, financial crisis, and financial interlinkages. 

Beginning with Part 18 below, these are new chapters for the upcoming book draft and at this time are not reflected in the ebook below.

Link to book is here or view embedded below.


お金と銀行業 - 新しい経済的展望

http://neweconomicperspectives.org/money-banking


お金と銀行


以下の投稿と教科書は、お金と銀行の問題を理解するための代替手段を提供するために書かれました。この記事は、春に書かれた内容に関連して改訂および編集されていますが、教科書ははるかに優れた文書です。教科書は投稿を使用しますが、それらを徹底的に編集して展開しました。資料が読みやすくなるように、すべてもフォーマットされています。


資料全体を通して、貸借対照表の概念は中心的であり、提示されたすべてのトピックを分析するために使用されます。貸借対照表は金融力学を理解することに関連しているだけでなく、論理的な議論を複式会計規則に適合させるように照会者に強制します。それができない場合、論理引数にエラーがあるため、これは非常に重要です。


本稿では、非主流ジャーナルで何十年も前から入手可能であったが最近までほとんど無視されてきた文献に頼って、金融および銀行の側面とそれらのマクロ経済との関係を詳しく分析しています。銀行の金融仲介理論ではなくなったマネーマルチプライヤー理論ではなくなりました。中央銀行が通貨の総計を管理するという考えはなくなりました。無関係です。金銭的利益、支払能力および流動性についての関心は資本主義の力学の中心であり、資金調達は貯蓄の量によって制約されることはありません。


通貨システムを扱う記事もまた、典型的な教科書よりもはるかに発展しており、他の資料と統合されています。このように、バランスシートの仕組みと現在価値などの財務の概念がよく理解された後は、通常はM&Bのテキストの最初にある「マネー」の章は3つの章の形式で表示されます。さらに、マクロ経済のトピックと銀行理論との関連は、インフレ、経済成長、金融危機、および金融の相互関連の問題を分析するために十分に確立されています。


パート1:貸借対照表

パート2:中央銀行のバランスシートと即時の影響

パート3:通貨ベース、準備金、および中央銀行のバランスシート

パート4:金融政策の実施

パート5:セントラルバンキングに関するよくある質問

パート6:財務省と中央銀行の相互作用

パート7:レバレッジ

パート8:プライベートバンキング事業

パート9:銀行規制

パート10:銀行による貨幣の創造

パート11:インフレ

第12部:経済成長と金融システム

パート13:バランスシートの相互関係とマクロ経済

パート14:金融危機

パート15:通貨システム

パート16:通貨システムに関するよくある質問

パート17:通貨システムの歴史

以下のパート18から始めて、これらは今後の本ドラフトのための新しい章であり、現時点では以下の電子ブックには反映されていません。


パート18(A):金融システムの概要:約束の世界

パート18(B):金融システムの概要:約束の世界

パート19(A):金融機関:概観

パート19(B):金融機関:概観

パート19(C):金融機関:概観

パート20:価格証券

パート21:金利

本へのリンクはこちらまたは下に埋め込まれたビューです。


#10 balance sheet By Eric Tymoigne

https://nam-students.blogspot.com/2019/06/10-balance-sheet.html@


Money and Banking-Part 10: Monetary Creation by Banks - New Economic Perspectives

http://neweconomicperspectives.org/2016/03/money-banking-part-10-monetary-creation-banks.html

Money and Banking-Part 10: Monetary Creation by Banks


貨幣と銀行業 - 第10部:銀行による金銭的創造


Money and Banking Part 13: Balance Sheet Interrelations and the Macroeconomy - New Economic Perspectives

016/4/23

http://neweconomicperspectives.org/2016/04/money-banking-part-13-balance-sheet-interrelations-macroeconomy.html

Money and Banking Part 13: Balance Sheet Interrelations and the Macroeconomy

By Eric Tymoigne


マネーアンドバンキングパート13:バランスシートの相互関係とマクロ経済 - 新しい経済的展望

http://neweconomicperspectives.org/2016/04/money-banking-part-13-balance-sheet-interrelations-macroeconomy.html


貨幣と銀行業第13回:バランスシートの相互関係とマクロ経済


Money and Banking - Part 1: Balance Sheet - New Economic Perspectives

2016/1/9

http://neweconomicperspectives.org/2016/01/money-banking-part-1.html

Money and Banking – Part 1: Balance Sheet

By Eric Tymoigne

http://neweconomicperspectives.org/2016/01/money-banking-part-1.html


お金と銀行業務 - パート1:バランスシート


#10 balance sheet By Eric Tymoigne

https://nam-students.blogspot.com/2019/06/10-balance-sheet.html


Money and Banking-Part 10: Monetary Creation by Banks - New Economic Perspectives

http://neweconomicperspectives.org/2016/03/money-banking-part-10-monetary-creation-banks.html

Money and Banking-Part 10: Monetary Creation by Banks

By Eric Tymoigne

貨幣と銀行業 - 第10部:銀行による貨幣創造 - 新しい経済的展望

http://neweconomicperspectives.org/2016/03/money-banking-part-10-monetary-creation-banks.html


貨幣と銀行業 - 第10部:銀行による金銭的創造


投稿日:Eric Tymoigne、2016年3月27日。

Eric Tymoigne著


最後の3つの投稿では、銀行の業務が収益性と規制上の懸念によってどのように制限されているか、そして銀行がどのようにこれらの制限を回避しようとしているかについて説明しました。銀行がどのようにしてクレジットおよび支払いサービスを他の経済に提供するかの詳細に入る時が来た。


銀行による貨幣の創出:信用および支払いサービス


銀行Aは事業を開始したばかりで、バランスシートは次のようになります。

b1

b1


今度は、世帯#2から100ドル相当の家を買いたい世帯#1が来ます。 #1は年収、利用可能な資産、通貨残高に関していくつかの質問をする銀行家(別名ローン担当官)と一緒に座ります、頭金#1はとりわけする気があります。銀行家は#1によって提供された答えを裏付ける文書化を求めます。


銀行家はまた、どの金融オプションが利用可能であるかを#1に示しています。つまり、銀行Aが受け入れるには、住宅ローン債権世帯#1の種類を発行しなければならないことを#1に示しています。


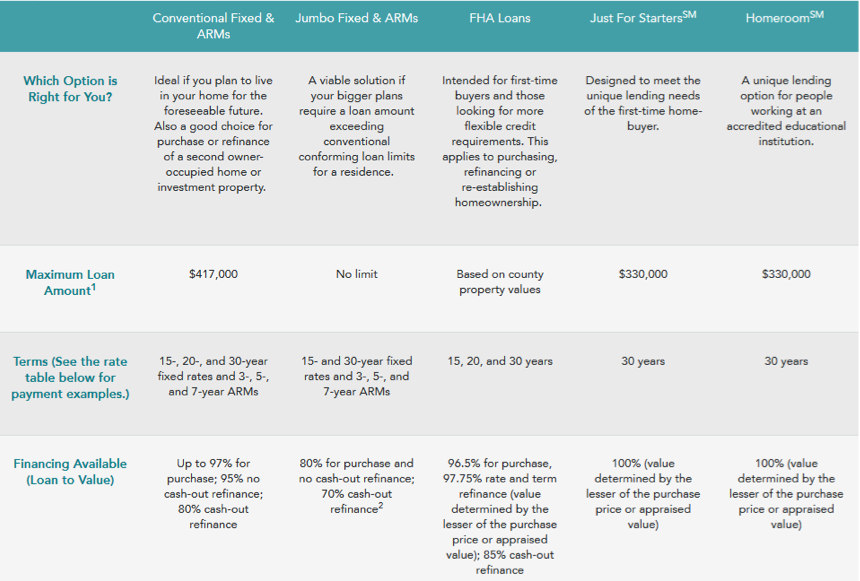
100%の資金調達(家計による前払いなし)の場合、銀行は最高33万ドルを提供する準備ができており、それは30年後の5.125%の固定金利住宅ローン債のみを受領することになる。銀行は20年の住宅ローン手形、または100%の資金調達のための3.875%の手形を受け入れることはありません。

最大97%の資金調達(世帯が最低3%の頭金を提供する)については、住宅ローンの種類は世帯が銀行に発行することができることを広げます。銀行は、特に30年物の3.875%固定金利手形、または15年物の3.125%固定金利手形を受け入れることをいとわない。世帯が20%の頭金を提供することができない限り、銀行が受け入れることになるノートの最大額面は417000ドルです。

#1は選択肢の1つを選び、#1が提供するすべての文書に添付されているクレジット申請書に記入します。その後、クレジット申請書は、さらなる分析のためにクレジット部門に送信され(3Cをチェックする)、承認されたか否かのいずれかである。

analysis (check the 3Cs) and either approved or not.

f1a

Figure 1. Example of types of mortgage note a bank will accept

Figure 1. Example of types of mortgage note a bank will accept

f1a


図1.銀行が引き受けるモーゲージノートの種類の例

図1.銀行が引き受けるモーゲージノートの種類の例


これはすべて、企業による債券発行と似ていますが、モーゲージノートには、それらを取引できる活発な市場がありません。債券の場合、企業は市場参加者が望むものとは異なる条件で債券を発行することがあります。その場合、債券は割引またはプレミアムで取引されます。 Fordが10年5%社債を発行したが、市場利回りが現在6%である(すなわち、市場参加者が6%の収益率を望んでいる)場合、市場参加者はFordから割引でのみ債券を購入します。簡単にするために、額面1000ドル、クーポンレート5%の利子を付けて(毎年、利子所得の50ドルを支払う)、6%の利回りを得るには、833ドルを支払う必要があります(50/833 = 6%)。 17%の割引


残念なことに#1では、約束手形の活発な市場は存在しないため、#1がAで要求される条件で住宅ローン手形を発行しない場合、その手形は100%割引で取引されます。 Aはそれを買いません(#1は常に他の銀行が提供するものをチェックすることができます)。それは証券に対する取引不可能な約束手形の不利な点であり、発行者は約束手形の特性(金利、満期までの期間など)に関して潜在的な保有者が要求するものに完全に拘束されます。


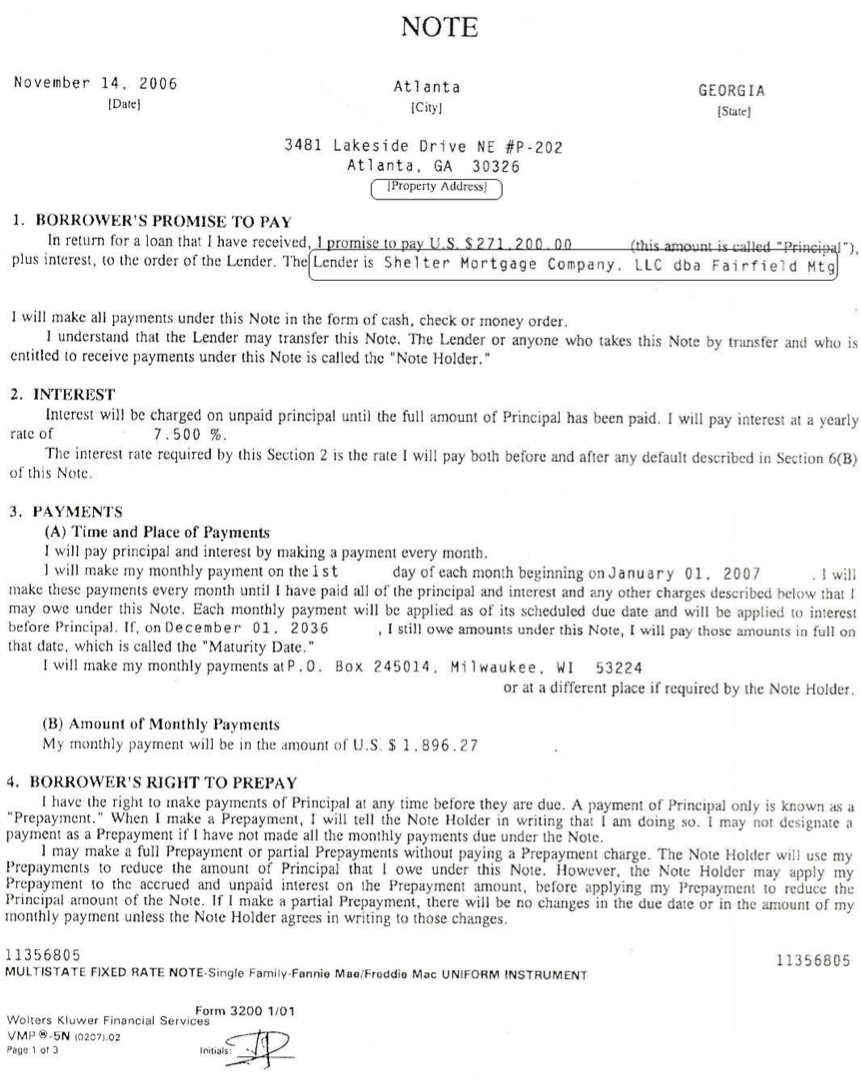
図2は、モーゲージノートの外観を示しています。世帯から銀行への約束を形式化した法的文書です。世帯は「Shelter Mortgage Co.」と呼ばれる銀行に30年の全額償却固定7.5%債を発行しました。これは、30年にわたり、世帯が発行済債の7.5%に相当する年利を支払うことを約束することを意味します。毎月、元本の一部を返済する。それは1896.27ドルの毎月の支払いになります。住宅ローン手形には、住宅ローン証書(および他の多くの文書)が添付されています。証書は、世帯が住宅ローン手形の条件を満たさない場合に銀行が住宅を差し押さえる権利を確立する法的文書です。

bank to seize the house if the household does not fulfill the terms of the mortgage note.

Figure 2. A mortgage note

Figure 2. A mortgage note

Going back to our household #1 who wants to buy a $100 house, suppose that bank A agrees to acquire from #1 a 30-year 5% mortgage note with a $100 face value. How does A pay for it? Bank A issues its own promissory note, called “bank account,” to #1.


Or, in terms of t-account, we have the following first step:


#1 then pays #2 and, for the moment, let us assume #2 opens an account at A (we will see what happens below when #2 has an account at a different bank):


Or in terms of t-accounts, we have the following when the payment occurs:

While the above shows the logic of what goes on when a bank provides credit services, the bank also provides payment services. This means that, in practice, the accounting is simpler because A makes the payment on behalf of #1, it does not let #1 touch any funds. Instead, A directly credits the account of #2 so the first step is actually:


図2.住宅ローンの手形

図2.住宅ローンの手形


100ドルの家を買いたいと思っている私たちの世帯#1に戻り、銀行Aが#1から額面100ドルの30年5%の住宅ローン手形を取得することに同意すると仮定します。 Aはどのように支払いますか?銀行Aは、「銀行口座」と呼ばれる独自の約束手形を#1に発行します。

b2

b2


または、tアカウントに関しては、次のような最初のステップがあります。

b3

b3


#1が#2を支払い、今のところ#2がAで口座を開設したと仮定します(#2が別の銀行に口座を持っている場合、以下のようになります)。

b4


b4


または、tアカウントに関しては、支払いが発生したときに次のようになります。

b5

b6

b7


b5


b6


b7


上記は銀行がクレジットサービスを提供するときに何が起こるかの論理を示していますが、銀行は支払いサービスも提供しています。これは、実際には

氷は、Aが#1の代わりに支払いをするので、会計はより簡単です、それは#1がどんな資金にも触れさせません。代わりに、Aは#2の口座に直接入金するので、最初のステップは実際には次のようになります。

b8

b8


そして、最終的な貸借対照表は次のとおりです(#1は支払いを実行するために銀行口座を持つ必要はありません。Aは#100をコンピューターに入力して#2の口座に入金するだけです)。

b9

b9


「銀行口座」と呼ばれる銀行の約束手形は、ポスト15で説明されているように金融商品の一種です。


上記の例から何を学ぶことができますか?


1.銀行が持っているものを貸していない:クレジットサービスを提供するとき、銀行は約束手形を顧客と交換する。


前のセクションの会計は一般的に「銀行貸付」と呼ばれます、すなわち、Aは100ドルを#1に貸すと言われています。ポスト2で述べたように、セントラルバンキングを研究するとき、「貸し出し」は「私はあなたにペンを1分間貸します」という資産を一時的に放棄することを意味します。これは明らかに起こっていることではありません。銀行は、顧客が銀行の資産の一部を一時的に使用できるようにするビジネスにはありません。それがローンサメビジネスです。銀行は自分が所有するものを貸していません。貸し出しはこれを意味するでしょう:


b10


世帯#1は銀行から現金を借りています。しかし、起こったことはこれです:


b11


誰かが尋ねるかもしれません:しかし、準備金の間接貸付はありませんか? #1が自分のアカウントに入金された後、それは準備金を引き出し、#2に現金支払いをする可能性があります。 #1はそれからAに予備を得る必要があるでしょう。答えは2つの理由でノーです:


実際には、銀行が#1の支払いをすることを見ました。その支払いはいかなる予備排水にもなる必要はない(それは上にはなかった)。

以下に示すように、#1がその債務を返済するためにAに準備金を返済する必要はなく、#1が実際にそうであったとしてもそうすることはめったにありません。

つまり、#1がAから準備金を借りていないだけでなく、#1はAに準備金を返済していません。Aと#1の間で直接または間接的に行われている準備金の貸し出しまたは借入はありません。銀行がすることは約束手形を経済単位と交換し、それらの支払いをすることです。引当金は、クレジットサービスの提供時ではなく、支払サービスの提供時に画像を入力することができます。


2.銀行はクレジットサービスを提供するために準備金を必要としません。


支払いサービスを提供するために準備金が必要になるかもしれませんが(#2に資金を移動する)、Aはクレジットサービスを提供するために準備金を必要としません。世帯#1でできることは約束手形を交換することだけです。


世帯は次の約束をしています。:30年間、未払いの住宅ローンの金額に5%の利子を支払い、毎月元本の一部を返済しています。

銀行は次の2つの約束をします。

口座名義人の意思で銀行口座を連邦準備銀行券に変換するには

#1が住宅ローンを処理するときに独自の約束手形を受け入れること。

これらはすべて約束であり、彼が約束手形を発行するときにその約束をすぐに履行するために必要なものを発行者のどれも持っている必要はありません。それが財務のポイントです。それは将来の銀行取引についてです。


無料のピザのためのクーポンを発行するピザ屋を考えてみてください。それはクーポンを発行する前に店は最初にピザを作る必要はありません、それは人々がクーポンで現れた場合にのみピザを作るでしょう。クーポンをピザに変換することは、店舗にとって費用がかかり、その収益性に影響を与えるが、クーポンの発行は、現在のピザの入手可能性によって制限されない。店はただ約束をしているだけで、誰もがどんな種類の約束もすることができます。難しい部分は、まず、この約束の真正性を誰かに納得させることであり、次に、それが誰かに受け入れられたら約束を満たすことです。


同様に、連邦準備制度の手形をオンデマンドで約束する銀行口座を発行できるようになるために、銀行は今や連邦準備制度の手形を必要としません。口座名義人が現金を要求したり、他の銀行に口座を持っている人に支払いをしたりする場合に限り、銀行は準備金を必要とします。 FRBはオンデマンドで、すなわち銀行の意思で準備金を提供するため、銀行は準備金を取得できないことを心配することはありません。準備金が不足することはありません。銀行が心配する必要があるのは、準備金を取得するためのコストです。通常、このコストは予測可能で比較的安定していますが、Volckerの実験では、中央銀行が準備金を極端に高くする可能性があることが示されています。


3.銀行は「他人のお金」を使っていない:貯蓄者と投資家の間の金融仲介者ではない


これは、1番目と2番目のポイントの発展です。 「融資」という言葉が由来すると思われる銀行業務の見方は、銀行は貯蓄者と投資家の間の仲介者であるということです。何人かの人々が現金を預けに来て、次に銀行がその現金を貸します。銀行が預金した資金を貸していないことは明らかです(この例では誰も預金していません)。さらに悪いことに、銀行は確かに他人の銀行口座を使って信用を供与していません。世帯#3が100ドルのクレジットを取得するために銀行Aに来ると仮定します。Aはこれを行いません。


b12


つまり、#2の資金を受け取って#3に渡すことはありません。 Th


つまり、t-accountは#2から#3への支払いであり、銀行Aによるクレジットではありません。クレジットを提供することは、クレジットの意味することとまったく同じです。クレジットは、コンピュータに番号を入力して行われます。この番号が入力されると、銀行は上記の2つの理由で口座名義人に責任を負います。


銀行は、預金者がクレジットサービスを利用するまで待つことはありません。たとえば、世帯#3が50ドル相当の連邦準備制度の紙幣を預金して口座を開設するとします。以下が発生します。


b13


Aは銀行以外の経済単位への準備金の貸付業務ではないため、この預金はクレジットサービスを提供する能力を高めるものではありません。銀行が自らの約束手形を発行することによって支払うため、銀行が非銀行プライベート約束手形を取得する能力は、貸借対照表の準備金の額とは無関係です。


銀行が約束手形を取得するために準備金を必要としない場合が1つあります。銀行が連邦準備制度の口座を持つ機関から手形を購入する場合です。例えば:


銀行が財務省のオークションに参加している場合、財務省は準備金の支払いのみを受け入れます。過去には、財務省は時々、銀行がTT&L(金融政策目的で使用される別の現金管理方法)を入金することによって財務省に支払うことを認めていましたが、1989年以降はもう行われていません。

他の銀行から約束手形を購入した場合

最初のケースでは、貸借対照表は次のように変化します(銀行は財務省から10ドル相当の財務省を買います)。


b14


そしてFRBの貸借対照表では、次のようになります。


b15


そして財務省:


b16


連邦機関は常に銀行がオークションを成功させるのに十分な準備があることを保証します、貯蓄者による連邦準備制度の手形の供給は宝物オークションの成功に無関係です。


4.銀行の約束手形は需要が高い


#1がAと契約を交わしたのはなぜですか?誰も#1の約束手形を受け入れず、多数の経済単位がAの約束手形を受け入れないため(誰かが受け入れない場合、Aは支払いで受け入れる現金への変換を提供します)。ポスト15は、銀行の金融商品が広く受け入れられている理由を説明しています。


もし#2が#1の約束手形を受け入れても構わないと思っていたとしたら、それまでの契約はどれも必要ではなかったでしょう。 #1の約束手形の問題は2つあります。


信用リスクがあります:#2はそれが支払われる利息が支払われることになると確信していない#1にその約束手形を返すことによって#1への支払いを行うことができるでしょう。 #2が将来#1に大きく負担される(この例では100ドルが多額になる)ことを知っていたなら、#1が信用できると仮定すると、#2はの支払いに対して#1の約束手形を受け入れる用意があるかもしれません。家。後で#2は#1の債務を支払うために#1の約束手形を使うことができます。

流動性リスクがあります。約束手形は30年以内に期限が到来するため、世帯#1はそれ以前に返済する必要はありません(ただし、モーゲージ手形では元本の返済が早期に可能になるため)。それまでの間、#2は他の誰も受け入れないという約束のメモで立ち往生しています。

銀行Aの約束手形は、持ち主が望むときにいつでも支払うことができ(現金払いに変換し、いつでも銀行に支払うために使用することができます)、銀行の信用力は強力です。これは、政府がAの約束手形を常に額面で連邦準備制度の手形に変換することができ、Aが破綻してもAの約束手形の(名目上の)価値が下がらないことを保証するためです。これにより、Aの約束手形は信用リスクから解放され、完全に流動的になります。


銀行はどのように利益を上げますか?金銭的破壊


銀行は約束手形のディーラーです。銀行は銀行以外の非連邦約束手形を取り、引き換えに独自の約束手形を発行します。銀行は彼ら自身の約束手形を取り戻すことによって利益を上げます。 2ヶ月目の初めに、#1は住宅ローンの手形を処理することによってAになされた約束を守り始めます。毎月の元利金は27セント(元本の線形返済を仮定して、100ドル/(30 * 12))で、最初の利息の支払いは41セントです(年間利率は5%なので、月額ベースでは0.407%= 1.05)1/12  -  1)最初の月の総債務返済は0.68ドルです。 #1はこれをどのように支払うのですか?


この金額を支払うには2つの方法があります。1つは銀行に0.68ドルの現金を支払うことです。もう1つのより一般的な解決策は、銀行の約束手形に組み込まれている約定をフォローアップすることです。銀行Aは、銀行Aに支払われる債務の支払い手段として約束手形を取り戻すことを約束しました。 #1のアカウントから。 #1がAに口座を持っていると仮定しましょう、その口座は最初に入金される必要があります:


b17


世帯#1はどのようにしてその口座に入金された資金を得ることができますか?


ケース1:#1は、政府に何かを販売するか、振替の支払いを受け取ることによって、連邦政府から1ドルの支払いを受け取ります。銀行の貸借対照表は次のようになります(Post 6は連邦政府との取引が主導することを示しています

クレジットとデビットの予約)

b18


ケース2:#1はウィジェットを生成するビジネスαに有効です。ビジネスαが始まったばかりです。まだ何も販売していませんが、ウィジェットを作成できるようにするには、原材料を購入して#1(唯一の従業員)を支払う必要があります。それを行うために、αはAから10ドルの営業融資限度額を要求しました(使用されていない限り、営業融資限度額はオフバランスシート項目です)。 αが#1を支払うと、次のことが起こります。

b19


#1世帯の毎月の賃金を支払うことができるように、企業αは1ドル借金をしました。ケース2が最初のセクションとどのように似ているかに注意してください。ビジネスは信用を得ます、銀行は支払いをします、ビジネスは少しの資金にも触れません。


ケース3:#1は#2から$ 1を受け取ります。どうして?私はあなたに決めさせます。

政府(または連邦準備口座を持っている機関)から来ていない#1に支払われた支払い(ケース1)、または#1によって以前に作成された資金を借金に入れた(ケース3) 1)以外の誰かが銀行に向かって借金をすることを要求する(ケース2)。さもなければ#1はA.によって提供される支払サービスへのアクセスを得ることができます


ケース2が勝ったので、今#1がAに最初の毎月のサービス0.68ドルを支払うのに十分な資金を持っていると仮定しよう。それはどのように記録されていますか?銀行による中央銀行への債務返済とまったく同じ手順です。


b20


または、Tアカウントに関しては、


b21


繰り返しになりますが、中央銀行の場合と同様に、銀行はこの取引からキャッシュフローを得ていません。その利益は資産側の準備金の額を増加させません。利益は銀行の純資産を増やすことです。最初の投稿で述べたように、利益は純資産に対する単なる追加であり、利益が表す金銭的利益はいかなるキャッシュフロー利益にも変換されないかもしれません。銀行に負っている債務の返済は銀行の金融商品を破壊することです。


Aにキャッシュフローの増加はありませんが、利益はその事業の実行可能性にとって非常に重要です。確かに、銀行は自己資本比率を満たし、純利益を向上させる利益を出す必要があります。さらに、資本は、銀行がその債権者を保護するための資金をより多く保有することを考えると、より多くの約束手形を作成することができるようになるため、クレジットサービスをさらに発展させるために極めて重要です。


Aの資本ポジションが時間とともにどのように進化したかを見てみましょう(重み付けなしの自己資本比率を単純化するために計算されます)。


1.開封後:


b22


自己資本比率=自己資本/資産= 200ドル/ 200ドル= 100%


2.#1にクレジットを付与した後


b23


自己資本比率= 200ドル/ 300ドル= 66.7%


3.αにクレジットを付与し、#1に支払いをした後


b24


自己資本比率= 200ドル/ 301ドル= 66.4%


4.#1から住宅ローンの支払いを受け取った後:


et1


資本比率= 200.41ドル/ 300.73ドル= 66.64%


Aがモーゲージサービスの支払いを受けるまでは、Aがより多くの信用を付与するため、資本のポジションは悪化します。利益は、銀行が自己資本の地位を回復し、さらに信用活動を追求することを可能にします。また、銀行は自己資本をさらに引き下げることなく、従業員に給料を支払うことができます。したがって、Aに1人の従業員(世帯#3)がいて、月額20セントの給与を受け取っている場合、次のように記録されます。


et2


銀行Aは、コンピューターに番号を入力して#3を支払います。自己資本比率は66.57%であり、Aがαに与信を付与した後の66.4%よりも依然として優れています。


銀行間支払い、引き出し、準備金要件、および連邦政府の業務:準備金の役割


準備金は前の議論からは明らかに欠けていますが、銀行はポスト3で説明されているように準備金が必要です。準備金は支払いサービス(銀行間支払い)、リテールポートフォリオサービス(引き出しおよび預金)、法律(準備金要件)および連邦政府の業務で入ります(税金、政府支出、そして国債のオークション)、そして他のFRBの口座名義人との取引(私達はそれを別にします)。


#1が#2を支払うところに戻って、#2がA銀行ではなくB銀行に口座を持っているとしましょう。その場合、AはBにAの代わりに#2の口座への入金を指示します。そしてAはそれがBにお世話になっていることを認めています:


b27


b28


銀行間の借金は準備金で決済されますが、小さな問題があります。銀行Aには準備金がありません。 Aはどうやって今それらを手に入れることができましたか?いくつかの可能性があります。


他の銀行やFRBへの非戦略的取引可能資産の売却、財務省によると:銀行Aは何も持っていません(Aはそれなしでは運営できないため、建物は戦略的資産です。#1の住宅ローンノートは取引できません)。

インターバンク市場での準備金の取得:超過資金でフィードファンド市場参加者から借ります。

FRBからの準備金の取得:割引ウィンドウを介してFedとの約束手形の交換

その準備金残高に一晩の当座貸越を記録します。

残業はAが準備金を得るための他の手段があるでしょう:


他の銀行は、Aに口座を持つ経済単位に代わって支払いをするようにAに要求します。

いくつかの経済単位はAで連邦準備制度のノートを預けるようになるでしょう

政府は、銀行Aの口座で経済単位に支払いをします(ケース参照)。

上記1)

しかし、今のところ銀行Aは準備金を持っていないので、ソース1から4を使用する必要があります。一晩の当座貸越を記録することは、非常に高い金利とペナルティの支払いを必要とするので最もコストのかかる解決策です。窓際に行くことは可能ですが、通常の時間では、米国に大きな不名誉があり、それは高価です。連邦資金市場で準備金を借りることは通常準備金を得るための好ましい手段です。まず、銀行Aが当座貸越枠を使用して銀行Bに支払うとします。


b29


残高が日中だけマイナスである限り、銀行Aは利子を支払う必要はありません。一日の終わりまでに、銀行Aは銀行Cから銀行間市場の準備金を借ります。


b30


この借金は翌朝に支払われるべきであり、翌日の終わりに、銀行Aが資金5、6、または7から十分な準備金を受け取るまで、銀行Aまたは他の銀行から借りる必要があります。つまり、インターバンク市場で一般的な利子率を支払う必要があります。これは、簡単に言うと連邦基金の利率目標です。たとえば、銀行Aが1か月間毎日借りなければならないとすると、最初の1か月の利益は、FFRが2%であると仮定した場合です。


利益=受取利息 - 支払利息= 0.41%* 100  -  0.083%* 100 = 0.327ドル


FFRが住宅ローン手形の金利を下回っている限り、銀行は利益を上げます。それは準備金を借りていなければそれはそれほど有益ではありませんが、それは有益です。


銀行間の支払いを行う必要性を超えて、国によっては銀行は準備金の要件を満たすことも要求されます。前のセクションの最後の貸借対照表から続けると、銀行Aには次の貸借対照表があります。


et3


銀行口座の総額は104.93ドルなので、準備要求比率が10%の場合、Aはバランスシートで10.49ドルの準備を取得する必要があります。再度準備金の源は1から7ですが、Aがすぐにそれらを必要とするならば、源1  -  3だけが準備金要求目的のために利用可能です(その場合Aは当座貸越を持つことができません)。会計上の意味合いと利益上の意味合いは、今示したものと同じです。たとえば、銀行Bから借りているとします。


et4


ポスト6はまた、銀行間債務の決済に必要な準備金および準備金の要件を超えて、財務省のオークションを決済し、税金を支払うために準備金を取得する必要性にも注目しています。


これらすべての場合(および口座名義人による現金の引き出しの場合)において、中央銀行は、支払システムが適切に機能する(経済単位が支払われ、債務が決済される)ことを確実にするために銀行システムのニーズに常に対応する。銀行は法律に従い(銀行が準備金の要件を満たすために必要な準備金を提供できるのはFRBだけです)、銀行以外の経済単位が必要な現金を確実に取得できるようにするためです。中央銀行が単に金利を目標としている限り、銀行は利用可能な準備金の量によって制約されることはありません。


いずれにせよ、準備金の量は銀行Aを制限しませんが、FRBは準備金の供給に価格を設定し、この価格は銀行Aの収益性に影響を及ぼします。そして預金者を維持する。銀行はまた、他の手段の中でも、銀行間借金を決済する前にネットで清算することによって準備金の需要を節約しようとする。


最後に、銀行は必要以上の準備金を保有しようとしません。ポスト3に示されているように、通常の時間では、銀行がそうするように要求されているため、ほとんどの準備金が保有されています。超過準備の需要は非常に小さく、事実上ゼロです。銀行はいつでも好きな量の準備金を手に入れることができるので、準備金ではほとんどできないため、そして余分な準備金を維持することでROAが低下するため、銀行は余分な準備金を維持する動機がほとんどありません。銀行は積極的に与信活動に先んじて準備金を取ろうとはしません、そして、信用活動が遅くなれば、彼らは準備金に対する彼らの需要を遅くし、余分な準備金の構築を避けるために新しい預金者の誘致を避けたいかもしれません。彼らは、一晩の当座貸越を記録しなくても済むように、少額の超過準備を維持することができます。


銀行がクレジットサービスを提供する能力を制限するものは何ですか?


ある銀行がその市場シェアを積極的に拡大したいと考えている場合、これにはいくつかの理由から規制当局の注目を集める傾向があります。


急速に成長するために、最善の戦略は他の銀行が資格を与えたくない経済単位に信用を提供することです。短い素数でない経済単位の場合これは、他の銀行よりも早く信用基準を緩めること、および/またはポスト8に示すように、当初の毎月の支払いが低いが将来の大きな支払いショックで約束手形を受け入れることを申し出ることによって行うことができます。どちらの場合も、債務不履行の可能性が高くなり、銀行にとっての自己資本の損失の可能性が高くなります。資産の質の低下は、規制当局の注目を集める可能性があります。

非流動資産に対する流動資産の比率は、同業他社よりも早く低下します。

その銀行間債務はraを膨らませるでしょう


銀行に代わって行われた支払いが急速に成長するにつれて、それは収益性を低下させ、その結果、資本基盤を構築する能力が低下する。

その収益の質は低下します。銀行が非プライム経済単位に多くのペイオプション住宅ローンを付与する場合、これらの単位は通常支払うべき利子の一部のみを支払います。しかし、発生主義会計では、銀行は受領期日までの全債務返済額を記録し、「ファントム利益」を記録することができます。発生主義の利子収入が比例しない場合、規制当局の注意を引く可能性があります。適切に使用すれば、業務を円滑にするための便利な手段です。

基本的に、銀行が他の業界よりも早く成長すると、そのCAMELS格付けは他のものに比べて上昇する傾向にあり、銀行間債務は持続不可能になります。最終的に規制当局は中止命令を発します。銀行が高額な非主要顧客にプレミアム金利でクレジットを提供することによって銀行が急速に成長する場合、銀行間債務を考えると、レバレッジとROAが上昇するにつれて短期的な収益性が上昇することに注意してください。しかし、そのような銀行は近い将来に急激な利益と資本を減少させるであろう大きな損失を経験するでしょう。このように、約束手形の交換によって引き起こされる金銭的創出プロセスには2つの制限があります。


信用基準:Aが#1が3Cの信用分析を満たさないと考えた場合、Aは#1の約束手形を受け入れず、したがって#1の銀行口座(または#2)を信用しません。

規制は、連邦準備制度が要件を満たすために必要なすべての準備金を提供するという前提ではなく、CAMELSの格付けに影響を与え、信用基準の緩和を制限し、銀行ができる資産の種類を制限する規制要素を通じてホールド。

ステップ移動


ポスト8で述べたように、数には安全性があります。銀行が段階的に成長する限り、つまり、銀行口座をほぼ同じ速度で作成する限り(したがって、資産をほぼ同じ速度で成長させる限り)、規制当局の注目を集めることはできません。


銀行の銀行間債務は、制御不能になることはありません。ある銀行に代わって支払いを行う要求は、他の銀行に代わって支払いを行う要求によって相殺されます。

少なくとも債務返済が開始されるまでレバレッジは上昇する可能性があり、流動性は低下する可能性がありますが、これらすべては業界レベルで発生するため、銀行は選び出されていません。

引受が適切に行われている限り、最終的には銀行が利益を上げ、資本が得られるため、レバレッジは時間の経過とともに低下します。しかし、Post 8で説明されているように、ほとんどの銀行が積極的に市場シェアの拡大を追求し、利回りを模索するならば、物事は手に負えないかもしれません。


銀行業の代替的見解に関する補足:貨幣乗数理論と金融仲介


銀行による貨幣創出についての今のところ信用されていない見解は、銀行がクレジットを提供できるようにするために積極的に過剰準備金を求めていると主張している。 10%の引当所要量比率では、論理は次のようになります。


中央銀行は、銀行Aから100ドル相当の宝物を買うことによって過剰準備金を注入します。

準備金は利子を稼いでいないので、銀行Aは世帯#1に100ドルのクレジットを提供し、世帯#2は銀行Bの世帯#2に支払います。銀行Bは現在100ドルの追加銀行口座と100ドルの追加準備金を持っています。銀行Bには90ドルの超過準備があります。銀行Cの世帯#4に90ドルを支払う世帯#3に90ドルのクレジットを付与します。銀行Cには現在90ドルの追加準備金と90ドルの追加銀行口座があるため、超過準備金は81ドルになります。 #5など。これは、銀行システムに余分な準備が残らなくなるまで続きます。

作成された銀行口座の合計は、銀行Aで100ドル、銀行Bで90ドル、銀行Cで81ドル、D銀行で72.9ドルなどとなります。これは、1000ドルの余剰準備金で1000ドルの銀行口座を作成できます。

結論:銀行の与信は、超過準備の量と準備所要比率によって制約を受けます。どちらも中央銀行がマネーサプライと最終的にはインフレを狙うために使うことができます。

銀行がどのようにクレジットを提供して金融商品を創出するかについてのこの見解には、いくつかの問題があります。


ステップ1は通常の金融政策の下では決して起こりません。FFRがゼロになるのを防ぐために、不要な超過準備金は銀行システムから排出されます。ポスト3に、銀行は準備金の必要性がほとんどないと指摘しています。 Volkerの実験では、マネーサプライをターゲットにすることを目的として、リザーブターゲットに移行しようとしましたが、これは失敗でした。

銀行がどのように機能するのかということではありません(ステップ2)。銀行は利益を求める機関であり、準備金が信用供与を待つのを待ちません。彼らは最初に信用を与え、そしてピザ店が最初にクーポンを印刷し、そして次に必要に応じてピザを作るのと同じ方法で、後に準備を探します。銀行が準備金を保有することを余儀なくされると、ROAが低下するだけで、税金のようなものになります。

銀行は、経済単位に債務を強制することはできません。銀行の信用は需要主導型であり、たとえ銀行が信用を提供する能力を向上させない多くの準備を持っていたとしても。銀行Aは#1が表示されるのを待たなければなりませんでした


何かが起こる可能性がある前に。そして、銀行Aが資金調達のために銀行に来るように#1を誘惑しようと試みたかもしれない間、最終的にそれは信用を取ることにした#1です。

ミルトンフリードマン自身もこのアプローチの問題を認識していた。「第二次世界大戦中に政府の有価証券に対するほぼ一定の金利パターンを支援するという金融政策を考えると、連邦準備制度は強力な通貨の量を効果的に管理できなかった。料金をそのレベルに維持するために必要な量を作成する必要がありました。このプロセスを、高金利の増加から預金通貨と預金準備率を通じた貨幣の増加までのプロセスとして説明するのが便利ですが、影響の連鎖は実際には逆の方向に進みました。その増加を生み出すのに必要とされる強力な資金の増加への指定された利率のパターンおよび他の経済状況と一致する貨幣の在庫の増加。」(Friedman and Schwartz 1963、566)。彼の見解には2つの大きな問題があります。

彼は第二次世界大戦の経験を一般的なケースではなく特別なケースと見なしているようだ。中央銀行は常に金利、少なくともFFR、少なくともバンド内をターゲットにしている。

彼の理論的な立場は主張できない:因果関係が確実に逆転することが知られている(貨幣供給に対する準備金ではなく、準備金に対する貨幣供給)ならば、「便利だから」反対のことが真実であるかのように進むことはできない。

銀行のもう1つの見方は、銀行は「他の人のお金」を貸すということです。人々はお金を貯めて銀行に預け入れ、銀行は預けたお金を貸し出すようになります。投稿はこれについて触れましたが、ここで問題があります:


銀行は世帯の貯蓄を貸していません。銀行は一時的にポールの資金を受け取ってピエールに渡しません。

銀行は準備金を非銀行に貸してはいません。

銀行は自分たちが持っているものを何でも貸しているのではありません。Pierreは一時的に銀行から現金を受け取りません。また、通常、借金の返済時に銀行に現金を返済することはありません。

貯蓄者は現金を預けることができるが、貯蓄者は現金の源ではない、現金はFRBから来る。そして連邦機関は銀行の要求で現金を作成する従って節約は信用を制限しない。

中央銀行と民間銀行による金銭的創造の限界


政府が転換不可能な通貨で運営している限り、財政は乏しい資源ではありません。銀行と中央銀行は、いつでも無制限の金額の金融商品を作成できます。無制限の金額の金融商品を作成することはできますが、次のような理由ではありません。


中央銀行にとって:通常の状況下では、準備金の創出プロセスの主な限界は、夜間の銀行間金利をプラスに維持する必要があることであり、これは基本的に中央銀行が銀行の要求に応じて供給しなければならないことを意味する。これ以上、それ以下ではありません。

銀行にとって:金銭の創出プロセスに対する中核的な限界は、収益性と規制の問題です。

この記事の最後に、上記の点を説明する図を載せます。与信の供給は、わずかに上昇傾向にあり、銀行が与信基準を設定して与信するにつれて垂直になります。ある時点で、信用が拡大するにつれて、許容可能な経済単位の残りのプールの信用力が低下するという事実を反映するように、供給は上方に傾斜している。与えられた一連の信用基準は、最低レベルの信用力とは何かを定義し、そのレベルを下回る人には信用が付与されません(したがって、垂直的信用の供給)。クレジット需要は下降傾向にありますが、あまり弾力的ではありません。ポスト5で説明されているように、企業による信用の需要は金利条件に非常に敏感ではありません。


図4銀行のクレジット市場

図4銀行のクレジット市場


今日完了しました。次はインフレです。


[2016年8月6日改訂]


The last three posts have explained how the operations of banks are constrained by profitability and regulatory concerns, and how banks operate to try to bypass these constraints. It is now time to go into the details of how banks provide credit and payment services to the rest of the economy.

Monetary Creation by Banks: Credit and Payment Services

Bank A just opened for business and its balance sheet looks like this:

b1

Now comes household #1 who wants to buy a house worth $100 from household #2. #1 sits down with a banker (a.k.a. loan officer) who asks a few questions regarding annual income, available assets, monetary balances, the downpayment #1 is willing to make, among others. The banker asks for documentations that corroborate the answers provided by #1.

The banker also shows to #1 what financing options are available, that is, the banker shows to #1 what type of mortgage note household #1 has to issue to be accepted by bank A. Figure 1 is taken from an actual website.

  • For 100% financing (no downpayment by household), the bank is prepared to provide up to $330,000 and it will only accept a 30-year 5.125% fixed-rate mortgage note. The bank will not accept a 20-year mortgage note, or a 3.875% note for 100% financing.
  • For up to 97% financing (household provides at least a 3% downpayment), the types of mortgage note that a household can issue to the bank widen. The bank is willing to accept a 30-year 3.875% fixed-rate note, or a 15-year 3.125% fixed-rate note, among others. The maximum face value of the note that the bank will accept is $417,000 unless the household is able to provide a 20% downpayment.

#1 picks one of the options and fills up a credit application that is attached to the all the documentation provided by #1. The credit application is then sent to the credit department for further analysis (check the 3Cs) and either approved or not.

f1a

Figure 1. Example of types of mortgage note a bank will accept

Figure 1. Example of types of mortgage note a bank will accept

All this is similar to bond issuances by corporations, except that mortgage notes do not have an active market in which they can be traded. In the case of a bond, a corporation may issue a bond with terms that are different than what market participants want. The bond will trade at a discount or a premium in that case. If Ford issues a 10-year 5% corporate bond but the market yield is currently 6% (i.e. market participants want a 6% rate of return), market participants will only buy the bond from Ford at a discount. To simplify, assume a bond with a $1000 face value and a 5% coupon rate (every year the bond pays $50 of interest income), then to get a 6% yield someone should pay $833 (50/833=6%); a 17% discount.

Unfortunately for #1, there is no active market for its promissory notes, so if #1 does not issue a mortgage note with the terms required by A, its note will trade at 100% discount; A will not buy it (#1 could always check what another bank would offer). That is the disadvantage of non-tradable promissory notes over securities, the issuer is completely bound by what potential bearers require in terms of the characteristics of the promissory note (interest rate, term to maturity, etc.).

Figure 2 shows what a mortgage note looks like. It is a legal document that formalizes a promise made by a household to a bank. The household issued a 30-year fully-amortized fixed-rate 7.5% note to a bank called “Shelter Mortgage Co.,” which means that, over 30 years, the household promises to pay an annual interest representing 7.5% of the outstanding note value and to repay some of the principal every month. That comes down to a monthly payment of $1896.27. The mortgage note is accompanied by a mortgage deed (and many other documents). The deed is a legal document that establishes the right of the bank to seize the house if the household does not fulfill the terms of the mortgage note.

Figure 2. A mortgage note

Figure 2. A mortgage note

Going back to our household #1 who wants to buy a $100 house, suppose that bank A agrees to acquire from #1 a 30-year 5% mortgage note with a $100 face value. How does A pay for it? Bank A issues its own promissory note, called “bank account,” to #1.

b2

Or, in terms of t-account, we have the following first step:

b3

#1 then pays #2 and, for the moment, let us assume #2 opens an account at A (we will see what happens below when #2 has an account at a different bank):

b4

Or in terms of t-accounts, we have the following when the payment occurs:


b5

b6

b7

While the above shows the logic of what goes on when a bank provides credit services, the bank also provides payment services. This means that, in practice, the accounting is simpler because A makes the payment on behalf of #1, it does not let #1 touch any funds. Instead, A directly credits the account of #2 so the first step is actually:

b8

And the final balance sheet is (#1 does not need to have a bank account for the payment to go through, A just credits the account of #2 by typing “100” on the computer)

b9

The promissory note of the bank called “bank account” is one type of monetary instrument as explained in Post 15.

What can we learn from the example above?

1. The bank is not lending anything it has: when providing credit services the bank swaps promissory notes with its clients

The accounting of the previous section is commonly referred to as “bank lending,” i.e. the A is said to lend $100 to #1. As stated in Post 2, when studying central banking, “lending” means giving up temporarily an asset, “I lend you my pen for a minute.” This is clearly NOT what is going on. Banks are not in the business of allowing customers to temporarily use some of the banks’ assets: that is a loan shark business. The bank is not lending anything it owns. Lending would mean this:

b10

Household#1 is borrowing cash from the bank. But what happened is this:

b11

One may ask: Is there not an indirect lending of reserves though? After #1 gets its account credited, it could withdraw reserves and make a cash payment to #2. #1 would then have to get reserves back to A. The answer is no for two reasons:

  • We have just seen that in practice the bank makes the payment for #1. That payment does not need to result into any reserve drainage (it did not above).
  • As shown below, #1 does not have to give back reserves to A to repay its debt, and #1 rarely, if ever, does so in practice.

So not only is #1 not borrowing reserves from A, but also #1 is not giving back reserves to A. There is no lending or borrowing of reserves going on between A and #1, either directly or indirectly. What a bank does do is to swap promissory notes with economic units and to make payments for them. Reserves may enter the picture at the time of the provision of payment services, never at the time of the provision of credit services.

2. The bank does not need any reserves to provide credit services

While it may need reserves to provide payment services (transferring funds to #2), A does not need any reserves to provide credit services to #1. All it does with household #1 is to exchange promissory notes:

  • The household makes the following promise: pay 5% interest on the outstanding mortgage value for 30 years and repay some of the principal every month.
  • The bank makes the following two promises:
    • To convert bank accounts into Federal Reserve notes at the will of the account holders
    • To accept its own promissory note when #1 services the mortgage.

All these are promises and none of the issuers has to have what is needed to fulfill the promise right away when he issue his promissory notes. That is the point of finance; it is about banking on the future.

Think of a pizza shop that issues coupons for a free pizza. The shop does not have to make pizzas first before it issues the coupons, it will make pizzas only if people show up with coupons. Converting the coupons into pizzas is costly for the shop and so affects its profitability, but the issuance of coupons is not constrained by the current availability to pizzas. The shop is just making a promise and anybody can make any kind of promise. The hard parts are, first, to convince someone of the genuineness of this promise and, second, to fulfill the promise once it has been accepted by someone.

In the same way, a bank does not have to any Federal Reserve notes now to be able to issue a bank account that promises Federal Reserve notes on demand. A bank will need reserves only if account holders request cash or make payments to someone who has an account at another bank. The Fed will provide reserves on demand, i.e. at the will of banks, so banks never worry about being unable to get reserves. Reserves will never run out. What banks do need to worry about is the cost of acquiring reserves. In normal times, this cost is predictable and relatively stable but the Volcker experiment shows that a central bank may make reserves prohibitively expensive.

3. The bank is not using “other people’s money”: it is not a financial intermediary between savers and investors

This is a development of the first and second point. A view of banking, from which the word “lending” probably comes from, is that banks are intermediaries between savers and investors. Some people come to deposit cash and then banks lend the cash. It is quite clear that a bank is not lending any funds that some deposited (nobody deposited anything in our example). And, worse offender, a bank is certainly not using others’ bank accounts to grant credit. Assume that household #3 comes to bank A to get a $100 credit, A never does this:

b12

That is, it does not take the funds of #2 and give them to #3. This t-account would be a payment from #2 to #3, not a credit by bank A. To provide a credit is exactly what credit means, it is about crediting account. The crediting is done by typing a number on the computer. Once this number is entered, the bank is liable to the account holder for the two reasons presented above.

Banks do not wait for depositors before they engage in credit services. Say household #3 comes to open an account by depositing $50 worth of Federal Reserve notes. The following occurs:

b13

This deposit does not enhance the ability to provide credit services because A is not in the business of lending reserves to non-bank economic units. The ability of the bank to acquire non-bank private promissory notes is unrelated to the amount of reserves on its balance sheet because a bank pays for them by issuing its own promissory notes.

There is one case where a bank does need reserves to acquire a promissory note: if a bank buys the note from an institution with a Federal Reserve account. For example:

  • If a bank participates in auction of treasuries, the Treasury only accepts reserves in payment. In the past, the Treasury sometimes allowed banks to pay for the treasuries by crediting the TT&Ls (another cash management method used for monetary-policy purpose), but it no longer does since 1989.
  • if it buys promissory notes from another bank

In the first case, the balance sheet changes as follows (says the bank buys $10 worth of treasuries from the Treasury)

b14

And on the balance sheet of the Fed the following occurs

b15

And the Treasury:

b16

The Fed always ensures that banks have enough reserves to make the auction successful, the supply of Federal Reserve notes by savers is irrelevant for the success of treasuries auctions.

4. The bank’s promissory note is in high demand

Why did #1 enter in an agreement with A? Because nobody else would accept #1’s promissory note and a large number of economic units accepts A’s promissory note (if someone does not, A offers conversion into cash that most accept in payments). Post 15 explains why bank monetary instruments are widely accepted.

If #2 had been willing to accept #1’s promissory note then none of the previous agreement would have been needed. The problem with #1’s promissory note are two folds:

  • There is a credit risk: #2 is not sure that it will get paid the interest due AND that it will be able to make payments to #1 by giving back to #1 its promissory note. If #2 knew that it would become heavily indebted ($100 is a lot in our example) to #1 in the future, then assuming that #1 is creditworthy, #2 may be willing to accept #1’s promissory note for the payment of the house. Later #2 could use #1’s promissory note to pay debts owed to #1.
  • There is a liquidity risk: the promissory note only comes due in 30-year so household #1 does not have to take it back before that time (though it could because mortgage notes usually allow accelerated repayment of principal). In the meantime, #2 is stuck with this promissory note that nobody else will accept.

Bank A’s promissory note is due at any time the bearer wants (conversion into cash on demand and it can be used to pay the bank at any time) and the creditworthiness of a bank is strong. This is all the more so that the government guarantees that A’s promissory note can always be converted into Federal Reserve notes at par, and that the (nominal) value of A’s promissory note will not fall even if A goes bankrupt. All this makes the A’s promissory note free of credit risk and perfectly liquid.

How does a bank make a profit? Monetary Destruction

Banks are dealers of promissory notes: banks take non-bank non-federal promissory notes and in exchange give their own promissory note. Banks make a profit by taking back their own promissory notes. At the beginning of the second month, #1 starts to honor its promise made to A by servicing the mortgage note. The monthly principal due is 27 cents ($100/(30*12), assuming linear repayment of principal) and the first interest payment is 41 cents (the annual interest rate is 5% so on a monthly basis the rate is 0.407% = (1.05)1/12 – 1) making the total debt service for the first month $0.68. How does #1 pay this?

There are two ways this amount can be paid, one is by giving $0.68 in cash to the bank. Another more common solution is to follow up on the promise embedded in the bank’s promissory note: Bank A promised to take back its promissory note as means of payment of debts owed to Bank A. Thus, another means to pay the mortgage is to debit $0.68 from the account of #1. Let us assume that #1 has an account at A, that account first needs to be credited:

b17

How can household #1 get funds credited to its account?

  • Case 1: #1 receives a $1 payment from the federal government either by selling something to the government or by receiving a transfer payment. The balance sheet of the bank would look like this (Post 6 shows that transactions with the federal government lead to reserve crediting and debiting)

b18

  • Case 2: #1 works for business α that produces widgets. Business α just started. It has not sold anything yet but must purchase raw materials and pay #1 (the only employee) to be able to produce widgets. In order to do that, α asked for a $10 operating line of credit from A (an operating line of credit is an off-balance sheet item unless it is used). When α pays #1 the following happens:

b19

Business α has gone into debt by $1 to be able to pay the monthly wage of household #1. Note how similar case 2 is to the first section: business gets credit, banks makes payment, business does not touch any funds.

  • Case 3: #1 receives a $1 from #2. Why? I let you decide.

One may note that, any payment made to #1 that does not come from the government (or an institution that has a federal reserve account) (case 1), or from funds that got created previously by #1 going into debt (case 3), requires that the someone else than #1 goes into debt toward a bank (Case 2). Otherwise #1 can get access to the payment services offered by A.

Let assume that case 2 prevailed so now #1 has enough funds to pay A the first monthly service of $0.68. How is that recorded? It is exactly the same procedure as debt-service payments by banks to the central bank.

b20

Or in terms of t-accounts:

b21

Again, like in the case of a central bank, the bank is not gaining any cash flow from the transaction. Its profit does not increase the amount of reserves on the asset side. What profit does is to raise the net worth of the bank. As noted in the first post, profit is just an addition to net worth, the monetary gain that profit represents may not translate into any cash flow gains. What the servicing of debts owed to banks does is to destroy bank monetary instruments.

While there is no cash flow gains for A, profit is extremely important for the viability of its business. Indeed, the bank needs to meet its capital ratio and making a profit improve net worth. In addition, capital is extremely important to allow any bank to further develop its credit service because it can now create more promissory notes given that it has more capital to protect its creditors.

Let us look at how the capital position of A evolved through time (to simplify the unweighted capital ratio is calculated):

1. After it opened:

b22

Capital ratio = net worth/assets = $200/$200 = 100%

2. After it granted credit to #1:

b23

Capital ratio = $200/$300 = 66.7%

3. After it granted credit to α and made the payment to #1:

b24

Capital ratio = $200/$301 = 66.4%

4. After it received the mortgage service payment from #1:

et1

Capital ratio = $200.41/$300.73 = 66.64%

Until A receives the mortgage service payment, its capital position worsens as A grants more credit. Profit allows a bank to restore its capital position and to further pursue credit activity. It also allows a bank to pay its own employees without further lowering its capital position. So if A has one employee (household #3) who receives a monthly salary of 20 cents then the following is recorded:

et2

Bank A pays #3 by typing a number on the computer. The capital ratio is 66.57%, still better than the 66.4% that prevailed after A granted credit to α.

Interbank payments, withdrawals, reserve requirements, and federal government operations: the role of reserves

Reserves are conspicuously absent from the previous discussions but banks do need reserves as explained in Post 3. Reserves enter the picture with payment services (interbank payments), retail portfolio services (withdrawals and deposits), the law (reserve requirements) and federal government operations (taxes, government spending, and auctions of treasuries), as well as transactions with other Fed account holders (we will leave that aside).

Let us go back to the point where #1 pays #2 and now let us say that #2 has an account at bank B instead of bank A. In that case, A instructs B to credit the account of #2 on behalf of A and A acknowledges it is indebted to B:

b27

b28

Interbank debts are settled with reserves but there is a small problem: bank A does not have any reserves! How could A get them right now? There are several possibilities:

  • Selling non-strategic tradable assets to another bank or the Fed, say treasuries: bank A does not have any (the building is a strategic assets because A cannot operate without it, the mortgage note of #1 is not tradable).
  • Getting reserves in the interbank market: borrow from a fed funds market participant with excess funds.
  • Getting reserves from the Fed: swap promissory note with Fed via the Discount Window
  • Recording an overnight overdraft on its reserve balance.

Overtime there will be other means for A to get reserves because:

  • Other banks will ask A to make payments on their behalf to economic units with accounts at A.
  • Some economic units will come to deposit Federal Reserve notes at A
  • The government will make payments to economic units with accounts at bank A (see case 1 above).

But right now bank A does not have the reserves so it needs to use sources 1 through 4. Recording an overnight overdraft is the costliest solution because it requires the payment of a very high interest rate and penalties. Going at the window is possible but, in normal times, there is a large stigma in the US and it is costly. Borrowing reserves in the federal funds market is usually the preferred means to get reserves. Assume that, first, Bank A uses the overdraft facility to pay Bank B:

b29

As long as the balance is negative only during the day, bank A does not have to pay any interest on it. Before the end of the day, bank A borrows reserves in the interbank market from bank C:

b30

This debt is due the next morning and, at the end of the next day, bank A will need to borrow again from bank C or another bank until it receives enough reserves from sources 5, 6, or 7. While it borrows from other banks, it must pay the interest rate that prevails on the interbank market, which, to simplify, is the Federal Funds rate target. Say bank A has to borrow every day for a month, then its profit for the first month is, assuming a FFR of 2% on an annual basis.

Profit = Interest received – interest paid = 0.41%*100 – 0.083%*100 = $0.327

As long as the FFR stays below the interest rate on the mortgage note the bank is profitable. It is not as profitable as it would have been had it not borrowed reserves, but it is profitable.

Beyond the need to make interbank payments, in some countries banks are also required to meet some reserve requirements. Bank A has the following balance sheet if we continue from the last balance sheet of the previous section:

et3

The total amount of bank account is $104.93 so A now needs to get $10.49 of reserves on its balance sheet if the reserve requirement ratio is 10%. Again the sources of reserves are 1 through 7 but if A needs them right away only sources 1-3 are available for reserve requirement purpose (A cannot have an overdraft in that case). The accounting implications and profit implications are the same as just presented. For example if it borrows from bank B:

et4

Beyond reserves needed for interbank debt settlements and reserve requirements, Post 6 also looks at the need to get reserves to settle auctions of treasuries and to pay taxes.

In all these cases (and the case of withdrawals of cash by account holders), the central bank always accommodates the needs of the banking system to ensure that the payment system works properly (economic units get paid and debts are settled), to ensure that banks follow the law (only the Fed can provide the reserves that banks need to meet reserve requirements), and to ensure that non-bank economic units can get the cash they need. Banks are never constrained by the quantity of reserves available as long as a central bank merely targets an interest rate.

While the quantity of reserves does not constrain bank A in anyway, the Fed does set a price on the supply of reserves and this price impacts the profitability of bank A. As such banks try to find the cheapest sources of reserves, which usually means attracting and keeping depositors. Banks also try to economize on reserve needs by net clearing interbank debts before settling them, among other means.

Finally, banks do not try to hold more reserves than what they need. As shown in a Post 3, in normal times, most reserves are held because banks are required to do so. Demand for excess reserves is very small and virtually zero. Banks have almost no incentive to keep excess reserves because they can get any amount of reserves they want at any time, because they cannot do much with reserves, and because keeping excess reserves lowers ROA. Banks do not proactively try to get reserves ahead of credit activities and, if credit activity slows, they slow their demand for reserves and may want to avoid attracting new depositors to avoiding building excess reserves. They may keep a slight amount of excess reserves to avoid having to record an overnight overdraft.

What limits the ability of a bank to provide credit services?

Say that a bank really wants to increase aggressively its market share, this will tend to draw the attention of regulators for several reasons:

  1. In order to grow fast, the best strategy is to provide credit to economic units that other banks do not want to qualify; for short non-prime economic units. This can be done by loosening credit standards faster than other banks and/or, as shown in a Post 8, by offering to accept promissory notes with initial low monthly payments but upcoming large payment shocks (hopefully refinancing will be possible down the road). Both cases lead to a higher chance of default and so a higher probability of loss of net worth for a bank. The decline in the quality of assets may attract the attention of regulators.
  2. The proportion of liquid assets relative to illiquid assets declines faster than its peers.
  3. Its interbank debt will balloon rapidly as payments made on behalf the bank grow quickly, which pushes down its profitability and so its ability to build its capital base.
  4. The quality of its earnings declines. If a bank grants a lot of pay-option mortgages to non-prime economic units, these units will usually only pay part of the interest due. However, accrual accounting allows a bank to record the whole debt service due as received and to record “phantom profits.” This may again attract the attention of regulators if accrual interest income grows out of proportion (accrual accounting is not a problem per se and is a convenient means to smooth business operations if used properly).

Basically, if a bank grows faster than the rest of the industry, its CAMELS rating tends to increase relative to others and its interbank debt becomes unsustainable. Ultimately regulators will issue a cease and desist order. Note that if a bank grows fast by providing credit too non-prime clients at a premium interest rate, then, given interbank debt, its short-run profitability rises as leverage and ROA rise. However, such a bank will then experience massive losses in the near future that will lower rapidly profit and capital. As such, there are two limits to the monetary creation process induced by the swapping of promissory notes:

  • The credit standards: if A considers that #1 does not meet the 3Cs of credit analysis, A will not accept #1 promissory note and so will not credit #1’s bank account (or #2’s).
  • Regulation, but not through reserve requirements given that the Fed will provide all the reserves needed to fulfill the requirements, but rather through regulatory elements that impact CAMELS rating, that constrain the loosening of credit standards, and that limit to the types of assets banks can hold.

Moving in step

As noted in a Post 8, there is safety in numbers. As long as banks grow in step, that is, as long as they create bank accounts at about the same speed (and so grow their assets at the about same speed), they may not attract the attention of regulators:

  1. Interbank debt for a bank will not balloon out of control: requests to make payments on a bank’s behalf are offset by requests to make payments of behalf of others banks.
  2. Leverage may rise, at least until debt servicing starts, and liquidity may fall but all this occurs at the industry level so no bank is singled out.

As long as underwriting is done properly, ultimately, banks will make a profit and capital will be gained and so leverage will decline overtime. However, as explained in a Post 8, things may get out of hand if most banks aggressively pursue growth in market shares and search for yield.

A Side Note on Alternative Views of Banking: the Money Multiplier Theory and Financial Intermediation.

A now discredited view of monetary creation by banks argues that banks actively seek excess reserves to be able to provide credit. The logic goes as follows with a 10% reserve requirement ratio:

  1. The central bank injects excess reserves by buying $100 worth treasuries from bank A
  2. Reserves do not earn any interest so Bank A provides a credit of $100 to household #1 who makes a $100 payment to households #2 at bank B. Bank B now has $100 of extra bank account and $100 of extra reserves. Bank B has $90 of excess reserves. It grants a credit of $90 to household #3 who pays $90 to household #4 at bank C. Bank C has now $90 of extra reserves and $90 of extra bank account so excess reserves is $81, upon which Bank C provides $81 credit to household #5, etc. This continues until there are no excess reserves left in the banking system.
  3. The sum of bank accounts created is $100 by bank A, $90 by bank B, $81 by bank C, $72.9 by bank D, etc., which amounts to $1000: With $100 of excess reserves banks could create $1000 of bank accounts.
  4. Conclusion: bank credit is constrained by the quantity of excess reserves and the reserve requirement ratio. Both can be used by the central bank to target the money supply and ultimately inflation.

There are several issues with this view of how banks provide credit and so create monetary instruments:

  • Step 1 never happens under normal monetary policy set up: any unwanted excess reserves is drained out of the banking system to prevent a fall of FFR to zero. Post 3 notes that banks have very little need for reserves. The Volker experiment tried to move toward reserve targeting with the goal of targeting money supply, but this was a failure.
  • It is just not how banks operate (step 2): Banks are profit-seeking institutions, they do not wait for reserves to grant credit. They grant credit first and look for reserves after, in the same way a pizza shop prints coupons first and then make the pizzas as needed. Forcing banks to hold reserves just reduces their ROA, it is like a tax.
  • Banks cannot force economic units to go into debt. Bank credit is demand driven so even if banks have a lot of reserves that does not improve their ability to provide credit. Bank A had to wait for #1 to show up before anything could happened. And while bank A could have tried to entice #1 to come to the bank for financing, ultimately it is #1 who decides to take a credit.
  • Milton Friedman himself recognized the problem with this approach: “Given the monetary policy of supporting a nearly fixed pattern of rates on government securities [during WWII], the Federal Reserve System had no effective control over the quantity of high-powered money. It had to create whatever quantity was necessary to keep rates at that level. Though it is convenient to describe the process as running from an increase in high-powered money to an increase in the stock of money through deposit-currency and deposit-reserve ratio, the chain of influence in fact ran in the opposite direction—from the increase in the stock of money consistent with the specified pattern of rates and other economic conditions to the increment in high-powered money required to produce that increase.” (Friedman and Schwartz 1963, 566). There are two main problems with his view:
    • He seems to view the WWII experience as a special case instead of the general case: central bank always targets interest rates, at least the FFR and at least within a band.
    • His theoretical position is untenable: if causality is known with certainty to be reversed (money supply to reserves instead of reserves to money supply), then one cannot proceed as if the opposite was true because “it is convenient.”

Another view of banking is that banks lend “other people’s money.” People save and deposit money in the bank, and the bank proceeds to lend the money deposited. The post touched on this above but here are the problems:

  • Banks do not lend the savings of households: bank do not temporarily take Paul’s funds and given them to Pierre.
  • Banks do not lend reserves to non-banks: They do not look if Paul deposited enough cash before granting credit to Pierre.
  • Banks are not in the business of lending anything they have: Pierre does not temporarily take cash from the bank, and, usually, does not give back cash to a bank when he services his debt.
  • Savers can deposit cash, but savers are not the source of cash, cash comes from the Fed. And the Fed creates cash at the demand of banks so saving does not constraint credit.

Limits to monetary creation by the central bank and private banks

Finance is not a scarce resource as long as the government operates with an inconvertible currency. Banks and the central bank, can create an unlimited amount of monetary instruments whenever they want. While they can create an unlimited amount of monetary instruments, they will not for the following reasons:

  • For central bank: under normal circumstances, the main limit to the reserve creation process is the need to maintain the overnight interbank rate positive, which basically implies that the central bank must supply whatever banks demand; no more, no less.
  • For banks: core limits to the monetary creation process are profitability and regulatory concerns.

I will finish this post with a Figure that illustrates the points made above. The supply of credit is slightly upward sloping and then becomes vertical as banks ration credit given a set of credit standards. The supply slopes upward to reflect the fact that, at a point in time, as credit grows the creditworthiness of the remaining pool of acceptable economic units falls. A given set of credit standards defines what a minimum level of creditworthiness is and anybody below that level will not be granted credit (hence the vertical supply of credit). The demand for credit is downward sloping but not very elastic. As explained in Post 5, demand for credit by businesses is very insensitive to interest-rate conditions.

Figure 4. The market for bank credit

Figure 4. The market for bank credit

Done for Today! Next is inflation.

[Revised 8/6/2016]


Money and Banking Part 13: Balance Sheet Interrelations and the Macroeconomy - New Economic Perspectives

016/4/23

http://neweconomicperspectives.org/2016/04/money-banking-part-13-balance-sheet-interrelations-macroeconomy.html

Money and Banking Part 13: Balance Sheet Interrelations and the Macroeconomy

By Eric Tymoigne


マネーアンドバンキングパート13:バランスシートの相互関係とマクロ経済 - 新しい経済的展望

http://neweconomicperspectives.org/2016/04/money-banking-part-13-balance-sheet-interrelations-macroeconomy.html


貨幣と銀行業第13回:バランスシートの相互関係とマクロ経済


投稿日:2016年4月23日、Eric Tymoigne

Eric Tymoigne著


過去の記事では、特定の貸借対照表のメカニズム、特に中央銀行と民間銀行のメカニズムに焦点を当ててきました。この記事では、経済の3つの主要なマクロ経済セクター、国内の民間セクター、政府のセクター、および外国のセクターの間のバランスシートの相互関係について考察します。このマクロの見方は、公的債務や赤字、より達成されそうな政策目標、景気循環などの問題についての重要な洞察を提供します。


統合に関する入門書


国内民間部門の貸借対照表は、すべての国内民間経済単位の貸借対照表をまとめたものです。これは、これらの部門が互いに持っているという主張が国内の民間部門の貸借対照表から削除されていることを意味します。たとえば、次の2つの貸借対照表が存在するとします。


ta1


ta2


それらが統合されている場合、私たちは最初のステップとして持っています


CB1


赤字の用語は貸借対照表の両側に表示され、連結プロセスでは削除されるため、世帯と銀行の貸借対照表は次のようになります。


CB2


残された唯一の金銭上の主張は、世帯や銀行以外の経済の他の部門に対して発行された、そしてそれらによって発行されたものです。したがって、連結プロセスによって、いくつかの重要な財務上の相互関係が解消されます。セクター間の関係を見ることだけに関心がある限りこれは問題ありませんが、これは経済の重要な側面を隠す単純化された図であることに注意する必要があります。


経済の三部門


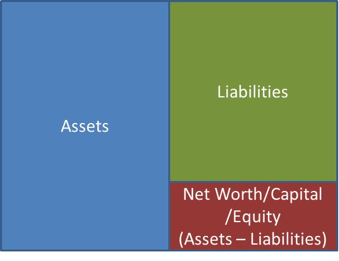
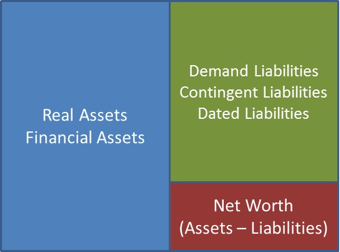
3つの主な部門間の金融相互関係の分析は国民所得と製品勘定科目(NIPA)から始めることによって行うことができますが、米国の金融勘定科目からの導出はより直観的です(NIPAからの導出は最後に行われます)この記事の)。以下は、投稿#1から抜粋したものです。貸借対照表は、経済単位が所有するもの(資産)と所有するもの(負債)を記録する会計伝票です(図1)。


図1.基本的なバランスシート

図1.基本的なバランスシート


金融資産は他の経済単位によって発行された請求であり、実資産は生産されたものです。金融負債は、他の経済単位に対して発行された請求です。貸借対照表は均衡しなければならない、すなわち、次の等式が常に成り立たなければならない:FA + RA≡FL + NW。別の言い方をすれば、


NW≡NFW + RA


つまり、あらゆる経済部門の資産は、純資産資産(NFW = FA  -  FL)と実質資産(RA)の2つの要因からもたらされます。


各マクロ経済セクターにはバランスシートがあります(図2)。 DPは国内の民間部門、Gは政府の部門、Fは「その他の国々」とも呼ばれる外国の部門です。政府部門には、国内政府(地方、州、連邦)と中央銀行のすべてのレベルが含まれます。米国の金融口座には国内金融部門の中央銀行の貸借対照表が含まれていますが(国内金融部門には国内の金融事業と金融機関が含まれています)、中央銀行を含めるのが便利です(ポスト6で説明)。政府部門の銀行。国内の民間部門には、国内世帯、国内非営利団体、国内金融事業、国内非金融事業、および国内農場が含まれます。外国部門にはそれ以外のもの(外国政府、外国企業、外国世帯など)が含まれます。形容詞「国内」は常に調査対象の参照国として使用されることに注意してください。 「外国」は他のすべての国を含みます。


図2マクロ経済部門のバランスシート


すべての債権者には債務者がいるので、債権者と債務者の主張を足し合わせると、相殺しなければなりません。世界経済(すべての部門が統合されている)の場合:


(FADP  -  FLDP)+(FAG  -  FLG)+(FAF  -  FLF)≡0


これは、すべての純資産の合計がすべての実物資産の合計に等しいことを意味します。つまり、実物資産のみが世界経済の富の源泉です(NW = RA)。


(NWDP  -  RADP)+(NWG  -  RAG)+(NWF  -  RAF)≡0


国内経済(政府部門と国内民間部門が統合されている)の場合、2つの資産源があります。すなわち、実質資産と外国部門の純金融資産です。公的債務は国内の民間部門にとっては資産であるが国内政府の債務であるため、公的債務は国内経済にとっての富(または貧困)の源泉ではない。国内マネーサプライは、国内保有者の資産であり、国内発行体の責任であるため、国内経済の経済的財産の源泉ではありません。


以前のアイデンティティはレベル(別名「株式」)に関しても成り立つことを考えると、それらはまたレベルの変化(別名「フロー」)に関しても成り立ちます。


Δ(FADP  -  FLDP)+Δ(FAG  -  FLG)+Δ(FAF  -  FLF)≡0


そして、金融口座では貯蓄を純資産の変化(S =ΔNW)として、投資を実資産の変化(I =ΔRA)として定義していることを知って、次のことも当てはまります。


(SDP  -  IDP)+(SG  -  IG)+(SF  -  IF)≡0


この最後の恒等式は、NIPA恒等式(S  -  1)+(T  -  G)+ CABF≡0に似ています(いくつかの違いについては下記を参照)。


NW  -  RA≡FA  -  FLとすると、(S  -  I)≡∆(FA  -  FL)となる。商品およびサービスの業務は、財務業務によって反映されています。 (S  -  I)とΔ(FA  -  FL)はどちらも正式に「純貸付」と呼ばれ、一方は資本勘定(S  -  I)から測定され、もう一方は金融勘定Δ(FA  -  FL)から測定されます。


このすべてが途中で経済学者によって提示される方法についてのいくつかの単語。エコノミストがこれら2つの項目の名前を変更するかもしれないことに注意してください。 (S  -  I)は "純貯蓄"(金融口座が純貯蓄を定義する方法とは異なる)と呼ばれることがあり、Δ(FA  -  FL)は "純金融累積"(NFA)と呼ばれることがある。したがって、我々は持っています:


NFADP + NFAG + NFAF≡0


経済セクターが他のセクターよりも問題の経済セクターに対するクレームを累積するよりも多くのクレームを累積する場合、経済セクターは正の純財務累積を記録し、それは期間中の純債権者(別名「純貸主」)です - △ (FA  -  FL)>0。反対のことが当てはまる場合、そのセクターはその期間中の純債務者(別名「純債務者」)です。最後に、このアイデンティティは時々書き直されます:


DPB + GB + FB≡0


DPBの場合、国内の個人収支、FBの対外収支(国内の経常収支の反対)、GBの政府収支、そして資本収支(純貯蓄)または金融収支(純財務)を通じて測定される。累積)。


理論、行動方程式および因果関係は、会計のアイデンティティを説明するために上では使われていません(これのうちの少しは、景気循環を調べるために以下で行われます)。アイデンティティは単にセクターによる資金の純注入が別のセクターに蓄積されなければならないと述べます。すべてのドルはどこかから来て、どこかに行かなければなりません。


いくつかの重要な意味


それらは多くの意味合いがありますが、主なものはセクターを単独で研究してはいけないということです。あるセクターが行うことは、他のセクターにも影響を及ぼします。政府の予算動向についての予測が行われるとき、予測が現実的であるかどうかを確かめるために予測者は他の部門への影響を認識しなければなりません。これは通常行われません。例えば、2000年代初頭の議会予算局は、連邦政府の黒字は成長を続けると予想していたが、国内の民間部門の観点からの含意を見逃していた。継続的に上昇する政府の黒字は、持続可能ではない対外収支を考えると、継続的に上昇する国内の民間赤字を意味します。恒久的な赤字を維持することができるのは、金銭的主権のある政府の連邦政府だけです。とりわけ、マクロ経済理論(Fullwiler)、緊縮財政の狂気(Rob Parenteau、Fullwiler)など、この枠組みには他にも多くの意味合いと用途があります。


1.経済プロセスの始まりは、誰かが借金をすることを要求します。


まだ生産も取得もされていない経済から始めましょう。


図3時間0における経済

図3時間0における経済


経済の誰かが建設に10ドルかかる家を建てたいとしましょう。国内生産を開始するためには、労働者に給料を支払わなければならず、原材料を購入しなければならない(ところで、それらは最初に生産されなければならなかった)。


民間企業がこれをすべて行うのを担当しているなら、それは資金を得なければなりません、そして、ポスト10はこれがどのようにされるかについて説明します。家が建てられたら、国内の民間部門のバランスシートはこのようになります。


CB6


統合は、住宅建設業者が銀行に対して負っている債務、ならびに賃金および原材料の支払いをすべて部門の内部にあるため、排除します。家が11ドルで国内の世帯に買収された場合、製造後、以下がマクロレベルで記録されます。


CB7


繰り返しますが、これらはすべて、かなりの数の基礎となる金融取引を隠します。


世帯は住宅ローンを取得し、1ドルの利益を上げる住宅建築業者に支払いました

会社は10ドルの負債を利子で返済しました

家は会社のバランスシートから世帯のバランスシートに移されました。

次の期間には、プロセスは最初からやり直されます。今回は、生産の一部をまかなうために、前の期間からいくらかの節約があるかもしれません。


代わりに、政府が家を購入する場合、約束手形(FLG)を使用して最初に購入資金を調達する必要があります。


CB8


政府による支出は、国内の民間部門が金銭的請求を獲得することを可能にしました。それは政府に対する主張です。


もし外国の経済単位が家を買うなら、そして住宅建築者は米ドルでの支払いを要求します。支払いの手順を実行することができるいくつかの方法がありますが、それらのすべてはドルで負債に入る外国部門を含みます。例えば:


外国人は国内の銀行で米ドルで銀行の前払いを要求するかもしれません

外国人はcを書くかもしれない外貨(ユーロと言います)を使ってチェックしますが、ハウスビルダーの国内銀行が小切手を受け取ると、その小切手を買い手の外資系銀行に送って、ドルの支払いを要求します。外国銀行は、国内銀行との債務を解決するために米ドルを借りる必要があります。

家が売られると、会社は利子、配当金および税金の支払いに使われる1ドルの利益を上げます。残されたのは利益剰余金、会社の節約です。世帯もいくつかの資金を節約します。しかし、誰かが生産を始めるために借金をしない限り、それは起こり得ません。貯蓄を大きくするには、借金を増やす必要があります。


2.すべてのセクターが同時に黒字を記録できるわけではありません。


すべてのセクターが同時に正味債権者になることができるわけではないことに気付くのは非常に簡単です。すべての債権者に債務者が存在しなければならないため、別のセクターが純債権者である場合、少なくとも1つのセクターが純債務者にならなければなりません。ほとんどの場合、国内の民間部門は黒字で、政府部門は赤字です(図1、2a、2b)。ニュージーランドは、政府と外国のセクターが黒字であるのに対し、民間セクターが赤字であるという特に奇妙なケースです。簡単にするために、NFAF = 0と仮定しましょう。


NFADP≡ -  NFAG


つまり、国内の民間部門(世帯と民間企業)が黒字を記録できるように(NFADP> 0)、政府は財政赤字(NFAG <0)を実行しなければなりません。


言い換えれば、政府が支出するとき、それは経済に資金を注入し、それが課税するとき、それは経済から資金を引き出す。政府がそれが課税するものより多くを使うならば、経済における政府による資金の純注入があり、この純注入はどこかに蓄積されなければなりません。単純な場合では、注入された資金を集める必要があるのは国内の民間部門です。


もちろん、逆の論理も当てはまります。民間部門の赤字が費やされるとき、それは政府だけに行くことができる経済に純額の資金を注入します。これにより政府は黒字を出すことができます。この単純な会計規則の強力な結果は、政府の黒字を達成することを目的とする政策が、閉鎖経済において、この政策が国内の民間部門の赤字を達成することを目的とすることを意味するということです。


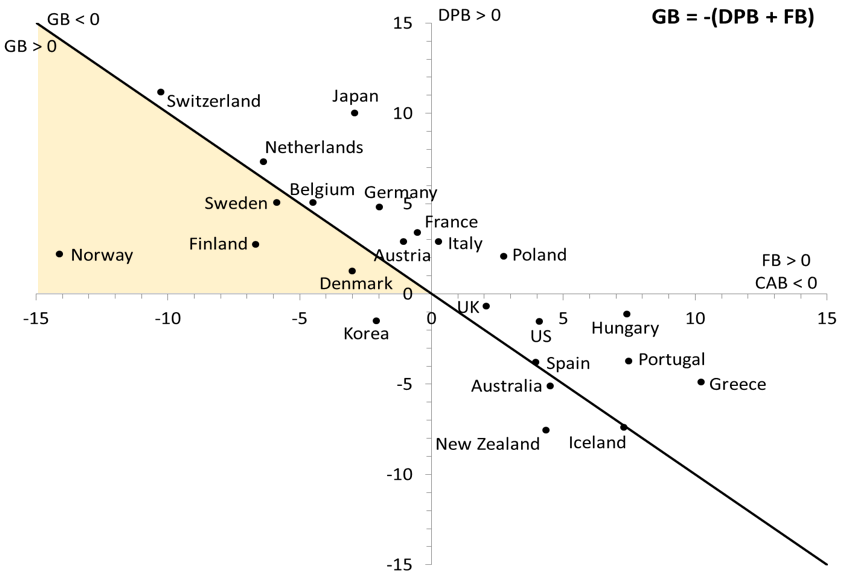
これを回避する1つの方法は、国内の経常収支黒字を達成しようとすることです。その場合、国は全面的に国内の黒字を達成することができます。図2aの黄色い領域は、他のすべての可能性に対して黄金の状態がどれほど小さいかを示しています。 OECD諸国の中では、これは主に北ヨーロッパ諸国によって達成されてきた(図2a、2b)。


国内の経常収支が黒字であることは、経常収支の赤字(FB <0)を記録することを意味するため、この状態を達成するのは困難である。繰り返しになりますが、すべての部門が同時に黒字になるわけではなく、すべての純輸出国(および/または純外国所得者)に対して純輸入国(および/または純外国所得支払者)が存在しなければなりません。したがって、国内経済が定期的に黄金国家を達成するためには、国内経済に対して支出を赤字化する意思のある少なくとも1つの外国がなければなりません。国がほとんどの場合、経常収支の黒字を達成しようと努力していることを考えると、これはほとんど不可能です。


さらに重要なことに、黄金の状態は世界レベルでは達成できません。すべての経済が経常収支黒字を達成しようとするならば、彼らが達成できる最善のものは均衡経常収支(FB = 0)であり、それは私たちをアイデンティティに戻す。


NFADP≡ -  NFAG


究極的には、政策決定者は自国の経済の中で何が起こっているのかを管理しようと努めるべきです。ある国が運がよければ、世界の他の国々での発展は最終的にその国が黄金の国家に到達することを可能にするかもしれません。しかし、黄金の国家に到達するという目標に基づいて政策選択を行うことは非常に長引いています。さらに、ゴールデンステートを達成することを目的とした政策は、国内部門が支出を赤字化する能力を制限し、それが国内経済の成長能力を制限している。確かに、目標は賃金の伸びを抑えること、政府の支出を減らすこと、そして増税によって国内の支出を制限することになります。これはコストを抑え(そして外国の買い手を引き付けるために輸出価格を低く抑えます)そして輸入を制限します(増大する国内支出は通常より多くの輸入を必要とし、国内の経常収支黒字に達することを難しくします)。


図1.米国の3大経済部門の純財政上の累積、GDP比。出典:連邦準備制度理事会

図1.米国の3大経済部門の純財政上の累積、GDP比。

出典:連邦準備制度理事会


図2a部門別収支、国際的見通し、2000〜2005年平均、GDPに対するパーセント出典:OECD

図2a部門別収支、国際的見通し、2000〜2005年平均、GDPに対するパーセント

出典:OECD


図2b。 2005-2010年の平均と同じです。

図2b。 2005-2010年の平均と同じです。


公的債務と国内の民間純資産


公債は、発行済の米国財務省証券(USTS)です。これには、市場性のある(T-bill、T-ノート、T-ボンド、TIPS、およびその他のいくつかの)証券および市場性のない有価証券(アメリカのノート、金の証明書、アメリカの普通預金、米国および地方自治体の国債発行)が含まれます。 、デポジットファンドが保有するあらゆる種類の政府口座シリーズ証券)。


2000年代初頭には、当時の財政黒字は今後も増え続け、さらに増加すると予想されていました。図3は、公的債務とマネタリーベースの予測経路を示しています。このような公的債務の動向の影響は何ですか?


図3公的債務とマネタリーベース出典:マーシャル2002

図3公的債務とマネタリーベース

出典:マーシャル2002


簡単に分析すると、1  - 政府部門には連邦財務省と中央銀行のみが含まれています。2  - 現時点では政府の唯一の責任は財務省です(中央銀行の負債は未解決です)。 4)以下のバランスシートが優先します。


et10


et11


今財務省は、そのすべての金融負債を排除したいと考えています。これ以上の公的債務はありません!そのための手段は何ですか?


ケース1:国債を満期にし、国庫の保有者に返済しないようにする:元本に対する100%の税金=> FADP = 0、国内の民間部門はすべての金融資産を失う。


ケース2:負債と見なされていない財務省の金融商品に切り替える(コインは連邦会計基準諮問委員会によって資本として扱われる):


ケース3:公的債務に含まれていない政府の別の責任に切り替える:連邦準備制度の債務で返済する:


これらの訴訟はすべて、債務不履行のない流動性のある、利子が確保されている証券を貸借対照表から削除するため、国内の民間部門にとって有害で​​す。国庫は、国内の民間部門に富を創出し、資本要件を満たし、安全な方法で受取利息を稼ぎ、中央銀行の借り換えチャネルにアクセスするために不可欠です。だから公債を返済するために主張するときあなたが望むものに注意してください。


景気循環と部門別バランス


3つのバランスの間の相互作用を見るだけで、景気循環を部分的に理解することができます。まず、通常3つのセクターすべてが黒字になることを望んでいることに気付くでしょう。


国内の民間部門は破産を避けるために黒字を記録する必要がある

州および地方自治体は破産を避けるために黒字を記録する必要があります

連邦政府

政府が他の国内部門と同様に財政的責任を負っていることを示すために黒字になるよう努める

自動安定剤のために膨張の間に余剰に向かう傾向があります。

外国部門:政治的および財政的安定性が黒字を達成する理由

もちろん、それらすべてを同時に黒字にすることは実際には不可能ですが、通常はすべてを同時に黒字にすることを望みます。


非政府部門(NGはDPとFの統合である)が望んでいる余剰(NGBd)にある状況から始めます。


ステップ1:NGB = NGBd> 0の経済成長がある:非政府部門ネットはそれが望むものを節約する。その場合、GB <0、政府は赤字であることは事実であるはずです。

ステップ2:政府は黒字になりたい(GBd> 0)。成長する経済において、自動スタビライザーは政府の赤字を引き下げます。それは政府が望んでいることです。しかし、政府が黒字へのリターンのペースに不満を抱いている場合、政府は税金(T)を上げたり支出(G)を下げたり(「国はその手段の範囲内で生活しなければならない」)。自動安定剤の効果。したがって、ΔGB> 0で、ΔNGB<0です。

ステップ3:NGB <NGBdなので、非政府部門は純資金の蓄積を増やす方法を見つけようとします。

DPB <DPBdの場合:消費と投資は減少する

FB <FBdの場合:国内輸出は減少する(すなわち、海外輸入は減少する)

ステップ4:政府支出の減少(G)とともに、非政府支出(C、I、X)の減少は、総所得の減少につながる(GDP = C + I + G + NX)。総所得の減少はGの自動的な上昇とTの自動的な減少をもたらすので、政府の収支は下がる(∆GB <0)。収入が安定する

ステップ5:政府収支の低下は、NGB = NGBdとなるまで、非政府収支の上昇(ΔNGB> 0)をもたらす。手順1に戻ります。

短期的な定常状態(つまり、総所得の水準が変わらない状況)になるには、2つの方法があります。


方法1:GBdがマイナスになる、すなわち政府が赤字になることを望んでおり、その赤字が均衡赤字レベル(GB *)に等しい。均衡赤字水準は、非政府部門の望ましい純貯蓄と一致する水準である:GB * = NGBd。これは金銭的主権のある政府にとっては実行可能な解決策ですが、政治家は金銭的主権のある政府がどのように運営されているのか理解していないため、恒久的な財政赤字を主張することに消極的です。

全人口、政治家そしてほとんどの経済学者。破産、インフレの加速、債券の自警団が通常呼び出されますが、どれも関連性はありません。

方法2:NGBdを負にするには

DPBdネガティブ:これは米国の1990年代後半から2000年代初頭に発生し(図1)、GB> 0が可能になりました。オーストラリア、韓国、ニュージーランド、およびいくつかのヨーロッパ諸国もまた、マイナスの国内民間収支を記録した(図2a、2b)。しかし、不足している国内民間部門は、それが究極的にはポンジー金融を意味するため、持続可能ではない(ポスト14参照)。

FBdマイナス(外国人による望ましいマイナスの経常収支、国内の経常収支はプラスで、政府と国内の民間セクターの純利益を達成するのに十分な大きさ):発展途上国の場合、マイナスのFBは外国セクターにとって許容できる。あるいは、外国が世界の他の国々のニーズを満たすために国際準備通貨を提供する必要性を理解している場合。しかしながら:

ある国が他の国々に対して支出を赤字化する必要がある場合、それは国内の民間部門または政府のいずれか、あるいはその両方がそうであることを意味します。国内の民間部門がそれを行うのであれば、それは不安定であり、政府がそれを行うのであれば、それは債務の額面金額に依存する(国内通貨で問題がなければ)。

国際準備通貨を供給している国にとって、負の国内CABは、通貨が変換不能である場合にのみ持続可能です。通貨が変換可能であれば、Triffinのジレンマが成り立ちます。ジレンマは、世界の他の国々が必要とする通貨を供給するためにその国が経常収支の赤字を持っていなければならないということですが、準備通貨の供給が他の国々の間で増加するので、国は転換需要の脅威に直面します。

結論


マクロ経済の部門別均衡のアイデンティティは、いくつかの欲求が両立しない、または達成するのが極めて難しいことを示しています。したがって、切り下げ、金利の変動、総所得の変動など、経済的な調整の量にかかわらず、決して望めないことがあり、不適合な望みを達成することを目的とした政策を続けることは非常に破壊的です。会計規則と互換性のある方針の目標と要望を設定し、次の点に注意することが最善です。


1つの黒字は他の人の赤字です

人を救うことは他人の気を悪くさせることです

自分の輸出は他人の輸入です

1つの支出は他の人の収入です

自分の金融資産は他人の借金です

クレジットは他人の借方です

会計規則は、いくつかの重要な結論を引き出すために通貨システムが機能する方法からの洞察と組み合わせることができます。


民間の国内部門は純債務者であることを避けなければなりません:財政の不安定化につながります(ポスト14参照)

(国内の経常収支を達成できない限り)通常、連邦政府は財政赤字である必要があります。そのような政府は、常にその会計単位で表示されている債務を返済することができます。

一部の経済は純輸入国である必要があります。

経済発展と資源が限られているのなら。その場合、民間融資ではなく対外援助が有効な手段です。

彼らが国際通貨を提供するならば(今日のアメリカ合衆国)。その場合、世界の他の国々はその通貨をネットセーブしたいので、通貨発行国は経常赤字を記録しなければなりません。

一部の国は純輸入国である必要があり、他の国は純輸出国である必要があります。累積が速すぎる場合には債務残業を解消し、成長率に対して金利を低く設定する必要があるかもしれません。

さらに進むために:国民所得と製品勘定の観点からのセクター収支


集計レベルでは、経済分析局によって管理されている国民所得と製品勘定(NIPA)は、商品とサービスに関するすべての経済活動を記録します。 NIPAは、国内総生産(GDP)に対する支出アプローチが会計の問題として成り立つことを私たちに示しています。


GDP≡C + I + G + NX


国内総生産は、国内民間最終消費(C)、国内民間投資(I)、財およびサービスに対する政府支出(G)、純輸出(NX)を含む、商品およびサービスに対するすべての最終支出の合計です。我々はまた、GDPに対する所得アプローチが会計の問題として成り立つことを知っています。


GDP≡YD + T


つまり、わずかな食い違いでは、国内総生産はすべての総収入の合計、または言い換えれば、すべての国内の可処分所得(YD)の合計(賃金、利益、利子および家賃)と全体の税額(所得と生産(T)に転送の純額)。この意味は:


YD + T≡C + I + G + NX


我々はまた、国際的な収入源を会計処理するとき、米国の国際取引口座(USITA)(それはアメリカ合衆国と世界の他の国々との間の関係を説明する)が私達に次のように言うことを知っている:


CABUS≡NX + NRA


経常収支(CAB)は貿易収支(純輸出)と海外からの純収入(NRA)の合計である(一方的な経常収支の純額)。


)。


NIPAとUSITAを組み合わせて、今やTに外国所得から得た税金を含めると(NRADは海外からの可処分の純収入)、次のようになります。


YD + NRAD + T≡C + I + G + CABUS


また、NIPAでは、総貯蓄(S)は可処分所得と消費の差、S≡YD + NRAD  -  Cとして定義されることがわかります。


(S  -  I)+(T  -  G) -  CABUS≡0


または、すべての純輸出国に対して純輸入国(CABF = -CABUS)があるとします。


(S  -  I)+(T  -  G)+ CABF≡0


この最後のアイデンティティーは、GDPから派生している点を除いて金融口座から得られるものと類似しているため、現在のアウトプット(つまり、新たに生産された商品やサービス)に関する懸念があるだけです。


さらに進むために:NIPAとFAによる節約の定義


国民所得および製品口座(NIPA)の貯蓄の定義は、金融口座(FA)のそれとは異なり、特定の条件下でのみ互換性があります。 NIPA貯蓄は、未消費収入として定義されています。たとえば、家計貯蓄は、可処分所得から消費財への支出を引いたものとして定義されます。S= YD  - C。FA貯蓄は、純資産の増加として定義されます。S=ΔNW。


この違いは、各アカウントの目的が異なることを反映しています。 NIPAは、分析の中核となる国内総生産(GDP)を用いて現在の経済活動を測定することに焦点を当てています。たとえば、経済がリンゴを生産し、そのリンゴの一部がリンゴのタルトを作るのに使用されているとしましょう。 GDPは直接消費のために残されたりんごのドル価値とリンゴのタルトのドル価値です。これはその年の生産量です。 NIPAの節約は、どんな収入が支払われても直接の消費のためのリンゴのタルトやりんごの購入を差し引いた値です。


FAは、バランスシートで何が起こっているのかを測定することを目的としているため、その観点ではより広範です。貸借対照表は、とりわけ、現在の生産よりもはるかに多くのことの影響を受けます。


それらは以前に生産された実資産を含みます

それらは金融資産を含みます

資産のドル価値は、生産または新規証券の発行による資産の在庫への追加ではなく、価格の変動(キャピタルゲイン/ロス)が原因で、時間の経過とともに変動します。

耐久消費財もあります。

貸借対照表の負債には元本返済が必要です。

たとえば、世帯が何も所有せず、何も所有していないとします。世帯は働き始め、10ドルを支払われるので、バランスシートは次のようになります。


純資産が10ドル増加したため、FAによれば貯蓄は10ドルになります。そして、NIPAも何も消費されていないことを考えると同意するでしょう。今度は世帯は店に行き、2ドル相当のりんごを買い、それが今月の唯一の支出です。


NIPAによると、節約は8ドルですが、FAの場合はまだ10ドルです。家庭がリンゴを食べると、定義は再び同じ値を与えます。


この場合の違いの原因は、NIPAがその目的のために行われた支出の量(店でリンゴを買う)によって消費を測定することです。貸借対照表の消費は、実物資産の価値が下がる(リンゴが食べられた)ことを意味します。最近、経済分析局は、2つのアプローチを1つの会計フレームワークに統合することを目的とした統合マクロ経済会計を作成しました。


Kenneth Bouldingは、貸借対照表と整合的な定義に基づいて全体のフレームワークを開発しました。 「支出」(りんごを買うために資金を使う:実物資産は上がり、金融資産は下がります)と「消費する」(りんごを食べる:実物資産は減価償却)の間には明らかな違いがあります。経済理論の発展はまた、モデルの説明がきついことを確認することを目的としています。ストックフロー整合性マクロ経済モデリングは、モデルが含むセクター間のすべての相互依存をモデルが説明することを保証します。


今日行った!次のトピックは「金融危機」で、最後のトピックは「お金」です。


[2016年8月6日改訂]


Past posts have focused on the mechanics of a specific balance sheet, specifically that of the central bank and of private banks. This post looks at the balance-sheet interrelations between the three main macroeconomic sectors of an economy: the domestic private sector, the government sector and the foreign sector. This macro view provides some important insights about issues such as the public debt and deficit, policy goals that are more likely to be achieved, the business cycle, among others.

A primer on consolidation

The balance sheet of the domestic private sector puts together the balance sheets of all domestic private economic units. This means that claims that these sectors have on each other are removed from the balance sheet of the domestic private sector. For example, assume that the following two balance sheets exist

ta1

ta2

If they are consolidated we have as a first step:

cb1

The terms in red appear on both sides of the balance sheet and are eliminated in the consolidation process so the balance sheet of households and banks is:

cb2

The only financial claims left are those issued to, and issued by, other sectors of the economy than households and banks. Thus, the consolidation process eliminates some important financial interlinkages. This is fine as long as one is merely interested in looking at relationship between sectors, but one should be mindful that this is a simplified picture that hides some important aspects of the economy.

The Three Sectors of the Economy

The analysis of financial interlinkages among the three main sectors can be done by starting from the National Income and Product Accounts (NIPA), but the derivation from the Financial Accounts of the United States is more intuitive (the derivation from NIPA is done at the end of this post). The following is refresher from post #1. A balance sheet is an accounting document that records what an economic unit owns (assets) and owes (liabilities) (Figure 1).

Figure 1. A Basic Balance Sheet.

Figure 1. A Basic Balance Sheet.

Financial assets are claims issued by other economic units and real assets are things that have been produced. Financial liabilities are claims issued to other economic units. A balance sheet must balance, that is, the following equality must hold all the time: FA + RA ≡ FL + NW. Or put differently:

NW ≡ NFW + RA

This means that the wealth of any economic sector comes from two sources, net financial wealth (NFW = FA – FL) and real wealth (RA).

Each macroeconomic sector has a balance sheet (Figure 2). DP is the domestic private sector, G is the government sector, F is the foreign sector also called the “rest of the world.” The government sector includes all the levels of domestic government (local, state, federal) and the central bank. While the Financial Accounts of the United States include the balance sheet of the central bank in the domestic financial sector—the domestic financial sector includes domestic financial businesses and monetary authority—, it is convenient (for reasons explained in Post 6) to include the central bank in the government sector. The domestic private sector includes domestic households, domestic non-profit organizations, domestic financial businesses, domestic non-financial businesses, and domestic farms. The foreign sector includes anything else (foreign governments, foreign businesses, foreign households, etc.). Note that the adjective “domestic” is always used for the reference country that is studied. “Foreign” includes all other countries.

Figure 2. Balance sheets of macroeconomic sectors

For every creditor there is a debtor, so if one adds together the claims of the creditors and the debtors they must cancel out. For the world economy (all sectors consolidated together):

(FADP – FLDP) + (FAG – FLG) + (FAF – FLF) ≡ 0

This implies that the sum of all net worth equals the sum of all real assets, that is, only real assets are a source of wealth for the world economy (NW = RA):

(NWDP – RADP) + (NWG – RAG) + (NWF – RAF) ≡ 0

For a domestic economy (government and domestic private sectors are consolidated), there are two sources of wealth: real wealth and net financial wealth on the foreign sector. The public debt is not a source of financial wealth (or poverty) for the domestic economy because it is an asset for the domestic private sector but a debt of the domestic government. The domestic money supply is not a source of financial wealth for the domestic economy because it is an asset of a domestic holder and a liability of a domestic issuer.

Given that the previous identities hold in terms of levels (aka “stocks”), they also hold in terms of changes in levels (aka “flows”):

Δ(FADP – FLDP) + Δ(FAG – FLG) + Δ(FAF – FLF) ≡ 0

And, knowing that the Financial Accounts defines saving as a change in net worth (S = ΔNW) and investment as a change in real assets (I = ΔRA), it is also true that:

(SDP – IDP) + (SG – IG) + (SF – IF) ≡ 0

This last identity is similar to the NIPA identity (S – I) + (T – G) + CABF ≡ 0 (see below for some differences).

Given that NW – RA ≡ FA – FL, then (S – I) ≡ Δ(FA – FL). The operations on goods and services are mirrored by financial operations. (S – I) and Δ(FA – FL) are both officially called “net lending”, one measured from the capital account (S – I) and the other measured from the financial accounts Δ(FA – FL).

A few words on the way all this is sometimes presented by economists. Beware that economists may change the name of these two items. (S – I) may be called “net saving” (which is different from how the Financial Accounts define net saving) and Δ(FA – FL) may be called “net financial accumulation” (NFA). Thus, we have:

NFADP + NFAG + NFAF ≡ 0

If an economic sector accumulates more claims on other sectors than the other sectors accumulate claims on the economic sector in question, the economic sector records a positive net financial accumulation, it is a net creditor (aka “net lender”) during the period—Δ(FA – FL) > 0. If the opposite is true, the sector is a net debtor (aka “net borrower”) during the period. Finally, this identity is sometimes rewritten as:

DPB + GB + FB ≡ 0

With DPB the domestic private balance, FB the foreign balance (the opposite of the domestic current account balance), GB the government balance, and “balance” being measured either through the capital accounts (net saving) or through the financial accounts (net financial accumulation).

No theory, behavioral equations and causalities, was used above to explain the accounting identities (a bit of this is done below to examine the business cycle). The identities simply state that a net injection of funds by a sector must be accumulated in another sector. Every dollar must come from somewhere and must go somewhere.

Some important implications

They are many implications but the main one is that one must not study a sector in isolation. Anything that a sector does has an impact other sectors. When a forecast about the budgetary trend of the government is made, the forecaster must recognize the implications for other sectors to see if the forecast is realistic. This is usually not done. For example, the Congressional Budget Office in the early 2000s expected the federal government’s surplus to continue to grow but neglected to look at the implication in terms of the domestic private sector. A continuously rising government surplus implies continuously rising domestic private deficit given the foreign balance, which is not sustainable. Only the federal government of a monetarily sovereign government can sustain permanent deficits. There are many other implications and uses of this framework such as macroeconomic theory (Fullwiler), the madness of fiscal austerity (Rob ParenteauFullwiler), among others.

1. The beginning of the economy process requires that someone goes into debt.

Let us start with an economy in which nothing has been produced or acquired yet.

Figure 3 An economy at time 0

Figure 3 An economy at time 0

Say that someone in the economy wants to build a house that costs $10 to build. In order for domestic production to start, workers must be paid, raw material must be purchased (those had to be produced first by the way).

If a private business is in charge of doing all this, it must obtain funds and Post 10 explains how this is done. The balance sheet of the domestic private sector would look like this once the house is built:

cb6

Consolidation eliminates the debt owed by the homebuilder to a bank, as well as wages and raw material payments, because they are all internal to the sector. Once produced, if the house is acquired by a domestic household for $11, the following is recorded at the macro level:

cb7

Again all this hides quite a few underlying financial transactions:

  • Households gets a mortgage and paid the homebuilder who make a $1 profit
  • Firm repaid its $10 debt with interest
  • House was transferred from firms’ balance sheet to household’s balance sheet.

The next period the process would start all over again. This time the firm may have some savings from the previous period to finance part of the production.

If, instead, the government buys the house, it must first fund the purchase by using a promissory note (FLG):

cb8

Spending by the government has allowed the domestic private sector to acquire a financial claim. It is a claim on the government.

If a foreign economic unit buys the house and the housebuilder requires payment in US dollar. There are several ways the procedure of payment can be done but all of them involves the foreign sector going into debt in dollars. For example:

  • The foreigner may ask for a bank advance in US dollars at a domestic bank
  • The foreigner may write a check in a foreign currency (says euros) but when the domestic bank of the housebuilder received the check, it will send the check back to the foreign bank of the buyer and to request a dollar payment. The foreign bank will need to borrow US dollars to settle its debt with the domestic bank.

Once the house is sold, the firm makes a $1 profit that is be used to pay interest, dividend and taxes. What is left over is retained earnings, the saving of the firm. Households will also save some funds. But none of that can occur unless someone goes into debt to start production. And for saving to be bigger, debt must increase.

2. Not all sectors can record a surplus at the same time.

It is quite straightforward to notice that not all sectors can be net creditors at the same time. At least one sector must be a net debtor if another sector is net creditor because for every creditor there must be a debtor. Most of the time, the domestic private sector is in surplus and the government sector is in deficit (Figures 1, 2a, 2b). New Zealand is a particularly odd case where the private sector is in deficit while government and foreign sectors are in surplus. To simplify, let us assume that NFAF = 0, therefore:

NFADP ≡ – NFAG

That is, for the private domestic sector (households and private companies) to be able to record a surplus (NFADP > 0), the government must run a fiscal deficit (NFAG < 0).

Put differently, when the government spends, it injects funds in the economy, and when it taxes it withdraws funds from the economy. If the government spends more than what it taxes, there is a net injection of funds by the government in the economy and this net injection must be accumulated somewhere. In the simple case, it is the private domestic sector that must accumulate the funds injected.

Of course, the reverse logic applies too. When the private sector deficit spends, it injects a net amount of funds into the economy that can only go to the government. This allows the government to run a surplus. A powerful consequence of this simple accounting rule is that a policy that aims at achieving government surplus implies, in a closed economy, that this policy aims at achieving a domestic private sector deficit.

One way to avoid this is to try to achieve a domestic current account surplus, in which case, a country can achieve domestic surpluses across the board—let us call that the “golden” state. The yellow area on Figure 2a shows how small the golden state is relative to all other possibilities. Among OECD countries, it has been achieved mainly by northern European countries (Figures 2a, 2b).

This state is difficult to achieve because a domestic current account surplus means that the foreign sector records a current account deficit (FB < 0). Again, not all sectors can be in surplus at the same time, and for every net exporter (and/or net foreign income earners) there must be a net importer (and/or net foreign income payer). Thus, for a domestic economy to achieve the golden state on a regular basis, there must be at least one foreign country that is willing to deficit spend vis-à-vis the domestic economy. This is hardly possible given that countries strive to reach current account surplus most of the time.

More importantly, the golden state is not achievable at the world level. If all economies try to achieve a current account surplus, the best they can achieve is a balanced current account (FB = 0), which brings us back to the identity:

NFADP ≡ – NFAG

Ultimately policy makers should confine themselves to try to manage what goes on in their domestic economy. If a country is lucky, developments in the rest of the world may ultimately allow that country to reach the golden state; but basing policy choices on the goal of reaching the golden state is a very long shot. In addition, policies that aim at achieving the golden state limit the ability of domestic sectors to deficit spend, which constrains the ability of the domestic economy to grow. Indeed, the goal becomes to constraint domestic spending by curtailing wage growth, by curtailing government spending and by raising taxes. This keeps costs down (and so keeps the price of exports low to attract foreign buyers) and limits imports (a growing domestic spending usually requires more imports and so makes it difficult to reach a domestic current account surplus).

Figure 1. Net financial accumulation of the three major economic sectors in the United States, percent of GDP. Source: Federal Reserve

Figure 1. Net financial accumulation of the three major economic sectors in the United States, percent of GDP.
Source: Federal Reserve

Figure 2a. Sectoral balances, an international perspective, 2000-2005 average, Percent of GDP Source: OECD

Figure 2a. Sectoral balances, an international perspective, 2000-2005 average, Percent of GDP
Source: OECD

Figure 2b. Same with 2005-2010 averages.

Figure 2b. Same with 2005-2010 averages.

3. Public debt and domestic private net wealth

The public debt is the outstanding U.S. Treasury securities (USTS). It includes both marketable (T-bills, T-notes, T-bonds, TIPSs, and a few others) and non-marketable securities (United States notes, Gold certificates, U.S. savings bonds, Treasury demand deposits issued to States and Local Gov., all sorts of government account series securities held by Deposit Funds).

In the early 2000s, the expectation of the day was that fiscal surpluses would continue to go on and rise even more. Figure 3 shows the projected path of the public debt and the monetary base. What are the implications of such trend of the public debt?

Figure 3 Public debt and monetary base. Source: Marshall 2002

Figure 3 Public debt and monetary base.
Source: Marshall 2002

To simply the analysis, assume that: 1- the government sector only includes the federal Treasury and the central bank 2- at the moment the only liability of the government is treasuries (no central bank liability is outstanding) 3- a closed economy (no foreign sector) 4- the following balance sheets prevail:

et10

et11

Now the Treasury wants to eliminate all its financial liabilities: no more public debt! What are the means to do so?

  • Case 1: Let treasuries mature and do not repay holders of treasuries: 100% tax on principal => FADP = 0, the domestic private sector losses all its financial assets.

  • Case 2: Switch to a Treasury’s financial instrument not considered a liability (Coins are treated as equity by the Federal Accounting Standards Advisory Board):

  • Case 3: Switch to another liability of the government that is not included in the public debt: repay with Federal Reserve’s liabilities:

All these cases are detrimental to the domestic private sector because they remove a default-free, liquid, interest earning security from the balance sheet—treasuries. Treasuries are essential, to create wealth in the domestic private sector, to meet capital requirements, to earn interest income in a safe way, and to access to refinancing channels of the central bank. So be careful what you wish for when arguing for repaying the public debt.

4. Business cycle and sectoral balances

One can get a partial understanding of the business cycles just by looking the interactions between the three balances. First, one may note that usually all three sectors wish to be in surplus:

  • Domestic private sector needs to record a surplus to avoid bankruptcy
  • State and local governments need to record a surplus to avoid bankruptcy
  • Federal government
    • strives to be in surplus to show that government is fiscally responsible like other domestic sectors
    • tends toward a surplus during an expansion because of the automatic stabilizers.
  • Foreign sector: Political and financial stability reasons to reach a surplus

Of course it is not actually possible for all of them to be in surplus at the same time, but all of them usually want to be in a surplus at the same time.

Start with a situation where the non-government sector (NG is the consolidation of DP and F) is at the surplus it desires (NGBd):

  • Step 1: there is a growing economy with NGB = NGBd > 0: Non-government sector net saves what it desires. In that case it must be true that GB < 0, the government is in deficit.
  • Step 2: Government wants to be in surplus (GBd > 0). In a growing economy, automatic stabilizers lower the deficit of the government, which is what the government wants. But, if the government is dissatisfied with the pace of return toward a surplus, it may implement austerity policies that raise taxes (T) and/or lower spending (G) (“the country must live within its means”), which compounds the effect of automatic stabilizers. Thus ∆GB > 0 and so ∆NGB < 0.
  • Step 3: NGB < NGBd so the non-government sector tries to find ways to increase its net financial accumulation:
    • If DPB < DPBd : consumption and investment decline
    • If FB < FBd: Domestic exports decline (i.e. foreign imports decline)
  • Step 4: Decline in non-government spending (C, I, X), together with the decline in government spending (G), lead to a decline in aggregate income (GDP = C + I + G + NX). The decline in aggregate income leads to an automatic rise in G and an automatic decline in T, so the government balance falls (∆GB < 0). Income stabilizes.
  • Step 5: the fall in the government balance leads to a rise of the non-government balance (∆NGB > 0) until NGB = NGBd. Back to step 1.

The only two ways to get a short-term stationary state (i.e. a situation where the level of aggregate income does not change) is:

  • Way 1: For GBd to be negative, i.e. the government is willing to be in deficit, and the deficit equals the equilibrium deficit level (GB*). The equilibrium deficit level is the one compatible with the desired net saving of the non-government sector: GB* = NGBd. This is a viable solution for a monetarily sovereign government, but politicians are reluctant to argue for a permanent fiscal deficit given the lack of understanding of how a monetary sovereign government operates by the general population, politicians and most economists. Bankruptcy, accelerating inflation, and bond vigilantes are usually invoked, although none of them are relevant.
  • Way 2: For NGBd to be negative:
    • DPBd negative: this did happen in the late 1990s and early 2000s in the United States (Figure 1), which made GB > 0 possible. Australia, Korea, New Zealand and some European countries also have recorded a negative domestic private balance (Figure 2a, 2b). However, domestic private sector in deficit is not sustainable because it implies ultimately Ponzi finance (see Post 14).
    • FBd negative (desired negative current account balance by foreigners so domestic current account is positive and large enough to fulfill the desired net saving of the government and domestic private sector): A negative FB can be tolerated for a foreign sector if it is a developing country, or if the foreign country understands the need to provide the international reserve currency to satisfy the needs of the rest of the world. However:
      • If a country needs to deficit spend vis-a-vis the rest of the world, it means that either the domestic private sector or the government do so, or both. If the domestic private sector does it, it is unstable, if the government does it, it depends on the denomination of the debt (if in domestic currency no problem).
      • For the country supplying the international reserve currency, negative domestic CAB is sustainable only if the currency in unconvertible. If the currency is convertible then the Triffin dilemma holds. The dilemma is that the country must have a deficit of its current account balance in order to supply the currency that the rest of the world needs, but the country faces threats of conversion demands as the supply of reserve currency grows among other countries.

Conclusion

The macroeconomic sectoral balance identity shows that some desires are not compatible or extremely hard to achieve. As such, regardless of the amount of economic adjustments—devaluation, change in interest rate, aggregate income fluctuation, etc.—some desires can never be achieved and it is highly destructive to continue policies that aim at achieving incompatible desires. It is best to set policy goals and desires that are compatible with accounting rules and to be aware that:

  • One’s surplus is someone else’s deficit
  • One’s saving is someone else’s dissaving
  • One’s export is someone else’s import
  • One’s spending is someone else’s income
  • One’s financial asset is someone else’s debt
  • One’s credit is someone else’s debit

Accounting rules can be combined with insights from the way monetary systems work to draw some important conclusions:

  • Private domestic sector should avoid being a net debtor: leads to financial instability (see Post 14)
  • A monetarily sovereign federal government usually needs to be in deficit (unless a domestic current account balance can be achieved): such government is always able to service debts denominated in its unit of account.
  • Some economies need to be net importers:
    • If they have limited economic development and resources. In that case foreign aid instead of private lending is the way to go.
    • If they provide the international currency (United States today). In that case, the rest of the world wants to net save that currency and so the currency-issuing country must record a current account deficit.
  • Given that some countries need to be net importers, others need to be net exporters: there may be a need to clear debt overtime if it accumulates too fast, and to set the interest rate low relative to growth.

To go further: Sector balances from the perspective of the National Income and Product Accounts

At the aggregate level, the National Income and Product Accounts (NIPA) managed by the Bureau of Economic Analysis records all economic operations on goods and services. NIPA shows us that the expenditure approach to gross domestic product (GDP) holds as a matter of accounting:

GDP ≡ C + I + G + NX

The gross domestic product is the sum of all final expenditures on goods and services, including domestic private final consumption (C), domestic private investment (I), government spending on goods and services (G), and net exports (NX). We also know that the income approach to GDP holds as a matter of accounting:

GDP ≡ YD + T

That is, with minor discrepancies, the gross domestic product is the sum of all gross incomes, or, stated alternatively, the sum of all domestic disposable incomes (YD)—wages, profits, interest and rent—and the amount of overall taxes (net of transfers) on income and production (T). This means that:

YD + T ≡ C + I + G + NX

We also know that, when accounting for international income sources, the U.S. International Transactions Accounts (USITA) (that accounts for the relation between the United States and the rest of the world) tells us that:

CABUS ≡ NX + NRA

The current account balance (CAB) is the sum of the trade balance (net exports) and net revenue from abroad (NRA) (net of unilateral current transfers).

If one combines the NIPA and USITA and now includes in T the taxes earned on foreign income (NRAD is disposable net revenues from abroad) we get the following:

YD + NRAD + T ≡ C + I + G + CABUS

We also know that, in the NIPA, aggregate saving (S) is defined as the difference between disposable income and consumption, S ≡ YD + NRAD – C, therefore:

(S – I) + (T – G) – CABUS ≡ 0

Or, given that for every net exporter there is a net importer (CABF = -CABUS):

(S – I) + (T – G) + CABF ≡ 0

This last identity is similar to the one obtained from the Financial Accounts except that it is derived from GDP and so is merely concerns with current output (i.e. newly produced goods and services).

To go even further: NIPA and FA definition of saving

The National Income and Product Accounts (NIPA) definition of saving is different from that of Financial Accounts (FA) and they are compatible only under specific conditions. NIPA saving is defined as unconsumed income. For example, households saving is defined as disposable income minus spending on consumption goods: S = YD – C. FA saving is defined as the increase in net wealth: S = ΔNW.

This difference reflects the different purpose of each account. NIPA is focused on measuring current economic activity with gross domestic product (GDP) at the core of the analysis. So for example, say that an economy produces apples and some of the apples are used to make apple tarts. GDP will be the dollar value of apples left for direct consumption and the dollar value of apple tarts. This is the production for the year. NIPA saving is the value of whatever income was paid less purchases of apple tarts and apples for direct consumption.

FA is broader in its perspective given that it aims at measuring what goes on in balance sheets. Balance sheets are impacted by many more things than just current production because, among others:

  1. They contain real assets that were previously produced
  2. They contain financial assets
  3. The dollar value of assets changes overtime because of changes in prices (capital gains/losses) instead of addition to the stock of assets via production or issuance of new securities.
  4. Some consumption goods are durable.
  5. Liabilities in the balance sheets require principal repayment.

For example, say that a household owns nothing and owes nothing. The household starts to work and gets paid $10 so its balance sheet is now:

Saving is equal to $10 according to FA because net wealth increased by $10, and here NIPA would also agree given that nothing has been consumed. Now the household goes to the store and buys $2 worth of apples and that is the only spending for the month:

According to NIPA, saving is $8 whereas it is still $10 for FA. Once the household eats the apples, the definitions give the same value again:

The source of difference in this case is that NIPA measures consumption by the amount of spending done for that purpose (buying the apple at the store). Consumption in a balance sheet means that the value of real asset falls (the apples have been eaten). Recently the Bureau of Economic Analysis created the Integrated Macroeconomic Accounts that aim at integrating the two approaches into one single accounting framework.

Kenneth Boulding developed an entire framework based on definitions consistent with balance sheet. A clear difference is made between “spending” (using funds to buy the apples: real assets go up and financial assets fall) and “consuming” (eating the apples: real assets depreciate). Developments in economic theory have also aimed at making sure that the accounting of a model is tight. Stock-flow consistency macroeconomic modeling ensures that a model accounts for all the interdependences between the sectors that the model contains.

Done for today! Next topic is “financial crisis” followed by the last topic, “Money.”

[Revised 8/6/2016]


Money and Banking - Part 1: Balance Sheet - New Economic Perspectives

2016/1/9

http://neweconomicperspectives.org/2016/01/money-banking-part-1.html

Money and Banking – Part 1: Balance Sheet

By Eric Tymoigne

http://neweconomicperspectives.org/2016/01/money-banking-part-1.html


お金と銀行業務 - パート1:バランスシート


投稿日:2016年1月9日、Eric Tymoigne

Eric Tymoigne著


私はM&Bコースを一緒にするために数年間苦労しました。それは一貫性に欠けていたし、学生はコースのさまざまな部分をリンクすることが困難でした。問題の大部分は、M&Bの教科書から来ています。これは、古くなったプレゼンテーションの他に、一貫したコアのない、さまざまな章の集まりです。それで私は教科書をあきらめて私自身のやり方で進み、そして私の学生の間で理解は劇的に増加しました。


金融システムの中核は財務書類で構成され、その中には貸借対照表があります。バランスシートはM&Bコースの大部分を教えることができる基礎を提供します:銀行と中央銀行による貨幣創造、お金の性質、金融危機、証券化、金融相互依存、あなたがそれを言う、それは1つまたはいくつかのバランスと関係がありますシート)。 Hyman P. Minskyが以前に注意したように、あなたがバランスシートに関してあなたの推論を置くことができないならば、あなたの論理に問題があります。


だから私のM&Bの「教科書」の第1章はバランスシートの仕組みについてです。はい、会計は面倒ですが、金融の仕組みを理解するためには、主要な会計の概念をよく理解しておく必要があります。通常、M&Bのテキストの最初にある「お金」の章は、バランスシートの仕組みと現在価値などの財務の概念がよく理解されてから初めて登場します。これは私がM&Bですることすべてを網羅するものではありません。私は、銀行、中央銀行、金融システムに関連するマクロ経済の話題、そしてお金に焦点を当てます。


貸借対照表とは何ですか?


それは、経済単位が所有しているもの(「資産」)および所有しているもの(「負債」)を記録する会計文書です。資産と負債の違いは、純資産、資本、または資本と呼ばれます。


図0a貸借対照表

図0a貸借対照表


資産と負債を分類するにはさまざまな方法があります。私たちの目的のために、貸借対照表は以下のようにもう少し詳細にすることができます。


図0b簡単な貸借対照表

図0b簡単な貸借対照表


金融資産は他の経済単位に対する債権であり、実物資産は物理的なもの(自動車、建物、機械、ペン、机、在庫など)に減らすことができますが、無形のもの(例えば、営業権)も含むことができます。デマンド負債は、債権者の要求により支払われるべき負債(例、口座保有者が現金を銀行口座から自由に引き出すことができる)であり、偶発債務は、特定の事由が発生した時(例、未亡人への生命保険支払い)負債は特定の期間に支払われる(例えば、利息および元本抵当支払は毎月支払期日が到来する)。


貸借対照表は、あらゆる経済単位に対して構成することができます。その単位は、人、会社、経済部門、国、誰でも、あるいは資産と負債を持つものでもよい。表1は、米国内の米国の世帯(および非営利団体)の貸借対照表です。 2015年第3四半期、米国の世帯は99.6兆ドル相当の資産を所有し、14.4兆ドル相当の負債を負っており、純資産は85.2兆ドル(99.6  -  14.4)に相当します。世帯は30.6兆ドルの実資産、68.9兆ドルの金融資産を保有していました。彼らの2つの主な負債は、住宅ローン(9.5兆ドル)と消費者信用、すなわちクレジットカード、学生の借金など(3.5兆ドル)でした。


fig0-c

表1世帯とNPOのバランスシート

出典:米国の金融口座


貸借対照表のルール


貸借対照表は複式会計規則に従っているので、貸借対照表は常に貸借対照表でなければなりません。つまり、次のことが常に当てはまる必要があります。


資産=負債+純資産


実用的かつ中心的な意味は、貸借対照表上の1つの項目の変更は、貸借対照表が均衡を保つように他の場所で少なくとも1つの変更によって相殺されなければならないということです。


非常に単純なバランスシートから始めましょう。唯一の資産は、20,000ドルを預けて銀行から8万ドルを要求することによって購入された1万ドル相当の家です。


図1.単純なバランスシート

図1.単純なバランスシート


銀行が4万ドルの元本(すなわち、未払残高)を許すことが住宅ローンに与える影響は何ですか?


図2住宅ローン元本返済の影響

図2住宅ローン元本返済の影響


住宅ローンの価値は40k減少し、自己資本の価値は40k増加したため、会計上の平等性は維持されます。


最初の貸借対照表に戻って、家の価値が2万ドル上昇したことによる影響は何ですか?


図3住宅価格の上昇による影響

図3住宅価格の上昇による影響


資産価値は20,000ドル上昇し、純資産は20ドル上昇しました。ここでも、会計の平等性は維持されます。


経済学者は、ポイントをもっと早く見つけて変更を強調するために、バランスシートの変更のみを記録する、いわゆる「T勘定」を使用することを好むことがあります(テーブルの形状はTのように見えるため)。


図4. thを記録するTアカウント


住宅ローン元本の返済

図4.住宅ローン元本の返済を記録するT勘定


図5.高い家の価値を記録するTアカウント

図5.高い家の価値を記録するTアカウント


オフセットがより明確に示されています。これは、貸借対照表の右側にある2つの項目の反対の変動(図4)と、資産と純資産の同額の変動(図5)から生じます。もちろん、会計上の平等を維持するために相殺が行われる2つの方法はこれらだけではありません。前進するにつれて、他の事件に遭遇するでしょう。重要なのは、平等A = L + NWが確実に維持されるように、バランスシートの少なくとも2つを変更しなければならないということです。常に尋ねなければなりません:相殺されるエントリーの変更は何ですか?これは、銀行と中央銀行がどのように機能するのかを研究する上で実際的な意味を持ちます。


バランスシートは何が変わりますか?


貸借対照表を変更する要因を3つのカテゴリに分類することができます。


キャッシュインフローとアウトフロー:純キャッシュフロー

収入および費用:純利益

キャピタルゲインおよびキャピタルロス:資産および負債の市場価値の純変動

これらのカテゴリは、貸借対照表よりも他の会計伝票に慎重に記録されていますが、このセクションでは、貸借対照表との関係に焦点を当てます。


ネットキャッシュフロー


キャッシュインフローおよびキャッシュアウトフローは、経済的単位によって保有されている通貨残高の量の変化、すなわち資産側で保有されている銀行口座の物理通貨または資金の量の変化につながる。一部の資産は現金の流入につながり、一部の負債および資本(配当金の支払い)は現金の流出につながります。


図6.貸借対照表とキャッシュフロー

図6.貸借対照表とキャッシュフロー


Figure 6. Balance sheet and cash flow

Figure 6. Balance sheet and cash flow

If the cash inflows are greater than the cash outflows, monetary assets held by an economic unit go up. The economic unit can use them to buy assets or pledge them to leverage its balance sheet (see Post 7). If net cash flow is negative, then monetary-asset holdings fall and the economic unit may have to go further into debt to pay some of its expenses.

Going back to our very simple balance sheet, assume that a salary of $40k is earned and that part of the salary is used to service a 30-year fixed-rate 10 % mortgage. Assuming linear repayment of principal to simplify (actual mortgage servicing is calculated differently), the cash flow structure looks like this:

Figure 7. Balance sheet and cash flows, an example

Figure 7. Balance sheet and cash flows, an example

The balance sheet at the beginning of the following year is (assuming all cash flows involve actual cash transfer instead of electronic payments):

Figure 8. Balance sheet after the cash-flow impacts


キャッシュインフローがキャッシュアウトフローよりも大きい場合、経済単位によって保有されている貨幣資産は上がります。経済単位はそれらを使って資産を購入したり、バランスシートを活用することを約束したりすることができます(ポスト7参照)。正味キャッシュフローがマイナスであれば、貨幣性資産の保有量は減少し、経費の一部を支払うために経済単位がさらに借金をしなければならなくなる可能性があります。


非常に単純なバランスシートに戻って、40,000ドルの給与が稼得され、その給与の一部が30年固定金利の10%住宅ローンの返済に使用されると仮定します。単純化する元本の線形返済を仮定すると(実際の住宅ローン返済は異なる方法で計算されます)、キャッシュフロー構造は次のようになります。


図7.貸借対照表とキャッシュフロー、一例

図7.貸借対照表とキャッシュフロー、一例


翌年の初めの貸借対照表は次のとおりです(すべてのキャッシュフローに電子決済の代わりに実際の現金振替が含まれると仮定して)。


図8.キャッシュフロー影響後の貸借対照表

図8.キャッシュフロー影響後の貸借対照表


バランスシートには、かなりの変化があります。現金の純流入額は29.3万ドルで、住宅ローンの元本は元本の返済額分減少し、純資産はこれら2つの変更を反映しています。


当期純利益


純利益は純資産の変化につながります。


当期純資産=以前の純資産+当期純利益


純利益(例えば、税引前利益が純利益の代用であること)は、正または負になることがあり、したがって純資産は増減することがある。前の例(図7と8)では、純キャッシュフローと純利益は同じものです。しかし、すべての収入が必ずしも現金の流入につながるわけではありません(ポスト4、10を参照)。


キャピタルゲインとキャピタルロス


最後に、資産および負債の価値は、それらの市場価値の変動により変動する可能性があります。会計処理が「時価評価」ベースで行われる場合、すなわち現在の市場価値に基づいて貸借対照表項目を評価することによって行われる場合、これらの変更は貸借対照表に計上され、それに応じて純資産が影響を受けます。


現在の純価値=前の純価値+当期純利益+当期純キャピタルゲイン


図3の例は、キャピタルゲインの影響を簡単に示しています。


資産および負債の時価の変動による影響は、それらが原価ベースで評価される場合には貸借対照表に計上されない可能性がある。金融資産については、その価値を記録するための3つの選択肢があります。レベル1の評価は利用可能な市場価格を使用します。活発な市場がない資産のレベル2評価では、参照市場として代理市場が使用されます。 Mark-to-Model(またはより皮肉な「Mark-to-Myth」)とも呼ばれるレベル3の評価では、資産にドルの値を与えるために社内モデルを使用します。 2008年の危機の間、主要な金融機関は一部の資産の市場価格は市場のパニックのためにそれらの真の価値を反映していないと主張しました。証券取引委員会は、資産の価値を維持するために、レベル2またはレベル3の評価に移行することを許可しました。多くのアナリストがこの決定に批判的であり、それが機関の大きな損失を隠すための便利な方法であると考えました。


それは今日のそれです!以下の投稿では、これらすべてを銀行および中央銀行に適用します。


[2016年7月21日改訂]

I struggled a few years to get an M&B course together. It lacked coherency and students had difficulty to link the different parts of the course. A good part of the problem comes from the M&B textbooks that, besides having outdated presentations, are a disparate collection of chapters without a coherent core. So I gave up with textbooks and went my own way, and comprehension dramatically increased among my students.

The core of the financial system consists of financial documents and among them are balance sheets. Balance sheets provide the foundation upon which most of an M&B course can be taught: monetary creation by banks and the central bank, nature of money, financial crises, securitization, financial interdependencies, you name it, it has to do with one or several balance sheet(s). As Hyman P. Minsky used to note, if you cannot put your reasoning in terms of a balance sheet there is a problem in your logic.

So chapter 1 in my M&B “textbook” is about balance-sheet mechanics. Yes accounting is tedious, but one must get a good grasp of key accounting concepts to understand financial mechanics. The “money” chapter, usually first in M&B texts, only comes much later once balance-sheet mechanics and financial concepts such as present value have been well understood. This will not cover everything I do in M&B. I will focus on banks, central bank, macroeconomic topics related to the financial system, and money.

What is a balance sheet?

It is an accounting document that records what an economic unit owns (its “assets”) and owes (its “liabilities”). The difference between its assets and liabilities is called net worth, or equity, or capital.

Figure 0a. A balance sheet

Figure 0a. A balance sheet

There are many different ways to classify assets and liabilities. For our purpose, a balance sheet can be detailed a bit more as follows:

Figure 0b. A simple balance sheet

Figure 0b. A simple balance sheet

Financial assets are claims on other economic units and real assets may be reduced to physical things (cars, buildings, machines, pens, desks, inventories, etc.) but may also include intangible things (e.g., goodwill). Demand liabilities are liabilities that are due at the request of creditors (e.g., cash can be withdrawn from bank accounts at will by account holders), contingent liabilities are due when a specific event occurs (e.g., life insurance payments to a widow), dated liabilities are due at specific periods of time (e.g., interest and principal mortgage payments are due every month).

Balance sheets can be constructed for any economic unit. That unit can be a person, a firm, a sector of the economy, a country, anybody or anything with assets and liabilities. Table 1 is the balance sheet of U.S. households (and non-profit organizations) in the United States. In the third quarter of 2015, U.S. households owned $99.6 trillion worth of assets and owed $14.4 trillion worth of liabilities, making net worth equal to $85.2 trillion (99.6 – 14.4). Households held $30.6 trillion of real assets, $68.9 trillion of financial assets. Their two main liabilities were home mortgages ($9.5 trillion) and consumer credit, i.e. credit cards, student debts, etc. ($3.5 trillion).

fig0-c

Table 1. Balance sheet of households and NPOs. 
Source: Financial Accounts of the United States

Balance sheet rules

A balance sheet follows double-entry accounting rules so A BALANCE SHEET MUST ALWAYS BALANCE, that is, the following must always be true:

Assets = Liabilities + Net Worth

The practical, and central, implication is that a change in one item on the balance sheet must be offset by at least one change somewhere else so that a balance sheet stays balanced.

Let’s start with a very simple balance sheet. The only asset is a house worth $100k that was purchased by putting down 20k and asking for $80k from a bank:

Figure 1. A simple balance sheet

Figure 1. A simple balance sheet

What is the impact of a bank forgiving $40k of principal (i.e. outstanding amount owed) on the mortgage?

Figure 2. Effect of Repayment of Mortgage Principal

Figure 2. Effect of Repayment of Mortgage Principal

The value of mortgage went down by 40k and the value of net worth went up by 40k so that the accounting equality is preserved.

Going back to the first balance sheet, what is the impact of the value of the house going up by $20k?

Figure 3. Effect of higher house price

Figure 3. Effect of higher house price

The asset value went up by $20k and the net worth went up by $20 and here again the accounting equality is preserved.

Sometimes, to get to the point more quickly and to highlight the changes, economists prefer to use so-called “T-accounts” (because the shape of the table looks like a T) that record only the changes in the balance sheet.

Figure 4. T-account that records the repayment of the mortgage principal

Figure 4. T-account that records the repayment of the mortgage principal

Figure 5. T-account that records the higher house value

Figure 5. T-account that records the higher house value

The offsetting is shown more clearly. It comes from opposite changes in two items on the right side of the balance sheet (Figure 4), and a change in asset and net worth by the same amount (Figure 5). Of course these are not the only two ways the offsetting is done to preserve the accounting equality. We will encounter other cases as we move forward. The point is that one must change at least two things in a balance sheet to make sure that the equality A = L + NW is preserved. One must always ask: what is the offsetting entry change? This has practical implications when studying how banks and central bank operate.

What makes the balance sheet change?

One can classify factors that change a balance sheet in three categories:

  • Cash inflows and outflows: net cash flow
  • Incomes and expenses: net income
  • Capital gains and capital losses: net change in the market value of assets and liabilities

These categories are recorded more carefully in other accounting documents than the balance sheet, but this section focuses on their relation to the balance sheet.

Net Cash Flow

Cash inflows and cash outflows lead to a change in the amount of monetary balances held by an economic unit, i.e. a change in the amount of physical currency or funds in a bank account held on the asset side. Some assets lead to cash inflows while some liabilities and capital (dividend payments) lead to cash outflows.

Figure 6. Balance sheet and cash flow

Figure 6. Balance sheet and cash flow

If the cash inflows are greater than the cash outflows, monetary assets held by an economic unit go up. The economic unit can use them to buy assets or pledge them to leverage its balance sheet (see Post 7). If net cash flow is negative, then monetary-asset holdings fall and the economic unit may have to go further into debt to pay some of its expenses.

Going back to our very simple balance sheet, assume that a salary of $40k is earned and that part of the salary is used to service a 30-year fixed-rate 10 % mortgage. Assuming linear repayment of principal to simplify (actual mortgage servicing is calculated differently), the cash flow structure looks like this:

Figure 7. Balance sheet and cash flows, an example

Figure 7. Balance sheet and cash flows, an example

The balance sheet at the beginning of the following year is (assuming all cash flows involve actual cash transfer instead of electronic payments):

Figure 8. Balance sheet after the cash-flow impacts

Figure 8. Balance sheet after the cash-flow impacts

Quite a few things have change in the balance sheet. There is a net inflow of cash of $29.3k, the principal of the mortgage fell by the amount of principal repaid, and net worth accounts for these two changes.

Net Income

Net income leads to a change in the net worth:

Current Net worth = Previous Net worth + Net income of the period

Net income (e.g., earnings before taxes is a proxy of net income) can be positive or negative so net worth may rise or fall. In the previous example (Figures 7 and 8), net cash flow and net income are the same thing; however, not all incomes necessarily lead to cash inflows (see Post  4, and 10).

Capital Gains and Capital Losses

Finally, the value of assets and liabilities may change because of changes in their market value. If accounting is done on a “mark-to-market” basis, i.e. by valuating balance-sheet items based on their current market value, these changes will be accounted in the balance sheet and net worth will be affected accordingly:

Current Net Worth = Previous Net Worth + Net income of the period + Net capital gains of the period

The example of Figure 3 is a simple illustration of the impact of capital gains.

The effect of a change in the market value of assets and liabilities may not be accounted in the balance sheet if they are valued on a cost basis. For financial assets, there are three options to record their value. Level 1 valuation uses the available market price. Level 2 valuation, for assets that do not have an active market, uses a proxy market as a point of reference. Level 3 valuation, also called mark-to-model (or more cynically “mark-to-myth”), uses an in-house model to give a dollar value to the asset. During the 2008 crisis, major financial institutions argued that the market prices of some assets did not reflect their true value because of a panic in markets. The Securities and Exchange Commission allowed them to move to level 2 or level 3 valuation to keep up the value of their assets. Many analysts have been critical of this decision and considered it to be a convenient way to hid major losses of institutions.

That is it for today! Following posts will apply all this to banks and central bank.

[Revised 7/21/2016]


ーーーー


☆☆


#10:152~(#21:339)


152
通貨、金銭および銀行業
図10.1
米国財務省利回り曲線(2016年2月3日)
3.0
2.5
2.0
1.5
1.0
0.5
0.0-
30歳
20歳
3 vr
5歳
10歳
7歳
1カ月
3カ月
6カ月
2歳
出典:著者自身。日次財務省利回り曲線率、リソースセンター、米国財務省からのデータ
(https://www.treasury.gov/resource-center/data-chart-center/interest-rates/Pages/default asnv)
満期中央銀行は短期金利を上げることによってビルのインフレ圧力に対応するかもしれない
急激に評価します。債券利回りは上がるかもしれませんが、金融政策の大幅な引き締めは短期的な
利子率はより早く上昇し、結果として利回り曲線は逆転する。それからより高い金利はそれから導くかもしれません
経済成長を遅らせるため。
平ら平らな利回り曲線は、正から逆へ、またその逆への移行で最も頻繁に見られます。として
利回り曲線が平らになると、利回りスプレッドはかなり低下します。イールドスプレッドは、例えば、
1年債と10年債の利回り。これは経済の将来の業績について何を示唆しているのでしょうか。
フラットな利回り曲線は、金融引き締め政策(短期金利の上昇)を反映している可能性があります。
景気後退後の金融緩和(短期金利の緩和)なので、逆利回り曲線は平坦化します。
イールドカーブの動きは、経済学者が伝える情報のおかげで、経済学者たちによってよく見守られています。
経済の全般的な健全性、中央銀行の金利調整の可能性、インフレ期待について
非政府部門での活動
公称利子率へのオーソドックスのアプローチ
決定:フィッシャー効果
BOX 10.2
固定された償還価値で固定されたクーポン債を保有することにおける1つのリスクは購買力リスクです。
金利にローンファンドのアプローチを採用している正統派のエコノミストは、
ほとんどの人は後でではなく今を消費することを好むでしょう。忘れられた消費を奨励する
今、貯蓄利回りは市場によって提供されなければなりません。利回りは人ができるようにすることを目的としています
現在犠牲にされているよりも将来的により多くを消費します。しかし、商品やサービスの価格が
その間、インフレは実質消費の増加を完全に一掃する可能性があります。
そのため、実質金利はゼロになります。
1年間で1,000ドルのクーポン国債に投資した人がいるとします。
100ドルの単一クーポン支払い。個人は償還日に1,100ドルを得ることを期待します。
保有期間中に価格が10%上昇すると仮定します。年末には、
以前は1,000ドルの費用がかかっていたが、今では1,100ドルの費用がかかるでしょう。言い換えれば、投資家はノーです
投資の結果として、年末になると好調です。名目利回りは相殺されています。

152

CURRENCY, MONEY AND BANKING

Figure 10.1

US Treasury yield curve (3 February 2016)

3.0

2.5

2.0

1.5

1.0

0.5

0.0-

30 yr

20 yr

3 vr

5 yr

10 yr

7 yr

1 mo

3 mo

6 mo

2 yr

Source: Authors' own. Data from Daily Treasury Yield Curve Rates, Resource Center, US Department of the Treasury

(https://www.treasury.gov/resource-center/data-chart-center/interest-rates/Pages/default asnv)

maturities. The central bank might respond to the building inflationary pressures by raising short-term interest

rates sharply. Although bond yields might rise, the significant tightening of monetary policy causes short-term

interest rates to rise faster, resulting in an inversion of the yield curve. The higher interest rates may then lead

to slower economic growth.

Flat A flat yield curve is seen most frequently in the transition from positive to inverted and vice versa. As

the yield curve flattens, the yield spreads drop considerably. A yield spread is the difference between say, the

yield on a one year and a ten year bond. What does this signal about the future performance of the economy?

A flat yield curve can reflect a tightening monetary policy (short-term rates rise), Alternatively, it might depict

a monetary easing after a recession (easing short-term rates) so the inverted yield curve will flatten out.

Movements in the yield curve are thus closely watched by economists due to the information that they convey

about the general health of the economy, possible central bank interest rate adjustments, and inflationary expect-

ations in the non-government sector

THE ORTHODOX APPROACH TO NOMINAL INTEREST RATE

DETERMINATION: THE FISHER EFFECT

BOX 10.2

One risk in holding a fixed coupon bond with a fixed redemption value is purchasing power risk.

Orthodox economists who adopt the loanable funds approach to interest rates believe that

most people would prefer to consume now rather than later. To encourage forgone consumption

now, a yield on savings must be provided by markets. The yield is intended to allow a person to

consume more in the future than has been sacrificed now. But if the prices of goods and services

increase in the meantime, then inflation could completely wipe out any gain in real consumption,

so that the real interest rate is zero.

Consider a person who invests in a one year $1,000 coupon treasury bond with an expected

single coupon payment of $100. The individual will expect to get $1,100 on the redem ption date.

Assume that over the holding period, prices rise by ten per cent. At the end of the year, a bas-

ket of goods that previously cost $1,000 would now cost $1,100. In other words, the investor is no

better off at the end of the year as a result of the investment. The nominal yield has been offset by


10お金と銀行
153
価格インフレ正統派のエコノミストは、投資家は「本当の」リターンによって動機づけられていると信じています
名目収益率による。これは、彼らが投資するという決定を消費者からのものであると見なしているからです。
現在消費するのか将来消費するのかを選択します。
実際の商品やサービスの形態。そのような貯蓄者がインフレを考慮に入れなければ、彼らの将来の現実は
消費は彼らが望むよりも少なくなります。
正統派のエコノミストは、名目利子率は実質金利と等しくなければならないと提案する
プラス予想インフレ。実質金利は、市場で決定された実質金利であると考えられています。
これは、資金の貯蓄を資金の投資需要と同等にすることになります。それは
したがって、実質均衡金利です。しかし、契約は額面で書かれているので、
名目金利に関しては、名目利子率には期待値に対する補償が含まれていなければなりません。
インフレ率。インフレ期待が上がるにつれて実質金利がこのように増加することをフィッシャーと呼びます。
アメリカの経済学者アーヴィング・フィッシャーに因んで名付けられた。
1930年代多くの市場参加者はこれが債券市場に当てはまると考えており、強い信念があります
名目利回りは購買力を維持するために市場によって調整される
満期が長くなるにつれて購買力リスクが高まる。これが多くのエコノ
ミストは、より長い成熟率が一般的に高くなると信じています。市場の利回りは
実際の収益率と予想インフレ率の補償。インフレの場合
金利は上昇すると予想され、その後市場金利はそれを補うために上昇します。この場合、私たちは期待するでしょう
フィッシャー効果がより長い時間でより大きく影響することを考えると、利回り曲線は急勾配になります。
イールドカーブの最短期間よりも満期のある債券。


10.4銀行は何をするのか
新古典派的見方:貨幣乗数
ほとんどの教科書では、銀行は預金を取り込む小さな仲間を抱える金融仲介機関として提示されています。
準備金の形でこれらの資金を調達し、残りを貸し出す。因果関係は、預金から準備金までです。
ローン各銀行が融資を行う際にこれらの原則に従うと、総融資は「預金」を通じて拡大します。
またはお金乗数。今のところ、すべての銀行が準備金の比率を維持する必要があると仮定します。
10パーセントの預金。これは彼らがから生じる準備金の損失に容易に対応できるようにするためかもしれません。
売り手が他の銀行に預けている顧客または(たとえば、商品やサービスへの)支出、または保有しようとしている顧客。
追加の現金。
これが新古典派学派が貨幣乗数の運用を説明する方法です
i)顧客が銀行Aに100ドルを預けるとします。
i)銀行Aは、10パーセントの必要な準備金に対する預金の比率に合わせるために、10ドルの準備金を留保します。に
ローンポートフォリオを拡大して利益を増やすと、残りの90ドルは
90ドル上昇します。
ii顧客はこれらの預金を使い、資金の受取人(売り手)は銀行Bに90ドルを預ける。
iv)その後、銀行Bは、0.9 X $ 90 = 81 $(必要に応じて10%、つまり追加準備金として9 $を維持)を貸し出す。
彼らの支出などを融資する顧客。
預金がある顧客
各段階で、貸し出されてから費やされる額が減少します。
銀行システムが作動し、その後900ドルの追加ローンが作成されます。最初の新規入金では、これは
預金は合計で1,000ドル増加しており、100ドルの準備金で「後退」しているため、必要額に適合しています。
10パーセントの割合。
この例は、主流の教科書がフラクショナルリザーブ銀行システムを呼んでいるものです。それが目的とする
銀行がどのようにしてお金を生み出すのかを説明する。これは、現在の預金の増加により、M1のマネーサプライを増やす。
初回入金額100ドルに関して、乗数は10です。これは、必要な準備金の逆数です。
0.1の比率。次の場合に非政府部門がより多くの現金を保有することを選択した場合は、より小さな資金倍率が得られます。
貸方が作成されます。

10 Money and Banking

153

the price inflation. Orthodox economists believe that investors are motivated by 'real' returns, not

by nominal returns. This is because they view the decision to invest as coming from consumers

who choose whether to consume now or to consume in the future, with consumption taking the

form of real goods and services. If such savers do not take account of inflation, their future real

consumption will be less than they desired.

Orthodox economists propose that the nominal inte rest rate must equal a real interest rate

plus expected inflation. The real interest rate is supposed to be the market-determined real

return that will equate the saving supply of funds with the investment demand for funds. It is

thus a real equilibrium interest rate. However, as contracts are written in nominal terms, that is,

in terms of nominal interest rates, the nominal rate must include compensation for the expected

inflation rate. This addition to the real rate as inflation expectations rise is called the Fisher

effect, named after the American economist Irving Fisher, who identified this relationship in the

1930s. Many market participants believe this applies to bond markets, and there is a strong belief

that nominal yields are adjusted by markets to preserve purchasing power

Purchasing power risk increases as the maturity lengthens. This is one reason many econo-

mists believe that longer maturity rates will generally be higher. The market yield is equal to the

real rate of return required plus compensation for the expected rate of inflation. If the inflation

rate is expected to rise, then market rates will rise to compensate. In this case, we wou ld expect

the yield curve to steepen, given that the Fisher effect will impact more significantly on longer

maturity bonds than at the short end of the yield curve.

10.4 What Do Banks Do?

The neoclassical view: the money multiplier

In most textbooks, banks are presented as financial intermediaries that take in deposits, hold a small frac

tion of these in the form of reserves, and lend out the remainder. The causality is from deposits to reserves to

loans. If each bank follows these principles in making loans, aggregate lending expands through the 'deposit

or money multiplier. For the moment assume that all banks are required to maintain a ratio of reserves to

deposits of ten per cent. This might be to enable them to readily respond to a loss of reserves resulting from

spending by customers (on goods and services, say) whose sellers bank elsewhere, or customers seeking to hold

additional cash.

This is how the neoclassical school of thought describes the operation of the money multiplier

i) Assume that a customer deposits $100 in Bank A;

i) Bank A retains $10 of reserves to conform to the required reserves-to-deposit ratio of ten per cent. To

expand its loan portfolio and increase profits, the remaining $90 is loaned to

rise by $90;

ii The customer spends these deposits and the recipient of the funds (seller) deposits $90 in Bank B;

iv) Bank B then lends 0.9 X $90 = $81 (keeping ten per cent, that is, $9 as additional reserves, as required) to a

customer to finance their expenditure and so on.

customer whose deposits

At each stage the amount lent and then spent diminishes, It can be readily shown that if this was the way the

banking system operated, then $900 of additional loans are created. With the initial new deposit, this means that

deposits have risen by a total of $1,000 and are 'backed' by $100 of reserves, thereby conforming to the required

ten per cent ratio.

This example is what the mainstream textbooks call a fractional reserve banking system. It purports to

explain how banks create money, which increases the M1 money supply due to the increase in current deposits.

In terms of the initial deposit of $100, the multiplier is 10, which is the inverse of the required reserves-to-deposit

ratio of 0.1. A smaller money multiplier results if the non-government sector chooses to hold more cash when

credit is created.


10お金と銀行
155
銀行の管理者は一般的に、銀行システムの積立金の総計レベルを知らず、気にすることもありません。
確かに、ローンを承認する前にローン担当者が個々の銀行の準備ポジションをチェックすることは決してありません。銀行貸出 - 
意思決定は、準備金のポジションではなく、準備金の価格と予想収益の影響を受けます。スプレッドが
資産(証券またはローン)の収益率と準備金の借入コストの間の幅が十分に広い
すでに準備金が不足している銀行でさえ、資産を購入するかローンを作り、準備金をまかなうでしょう。
インターバンク市場で準備金を購入することによって必要とされる。銀行間市場は銀行を結ぶ
必要に応じて、お互いに準備金を貸したり借りたりします。
重要な点は、銀行が企業や世帯に融資をするとき、それは準備金を貸すことではないということです。
銀行の貸出は、準備金が増えればそれほど困難ではないのと同様に、準備金が増えれば簡単にはなりません。銀行の準備金はありません
お金の乗数と端数準備金の物語で主張されている方法でお金の創造に資金を提供する。
銀行は、融資する前に入金が来るのを待ちません。
銀行と他の種類の企業との主な違いは、負債の性質にあります。銀行が作る
「借り手」のIOUSを購入することによる「融資」。これは銀行の負債、通常要求払預金を、少なくとももたらす、
当初、それは借り手の資産として現れます。したがって、ローンを担保している銀行の顧客は同時に存在します。
EV
デマンドデポジットを保有しているため、銀行の「債権者」であるだけでなく、銀行への「債務者」でもあります。これらの債権者
交換媒体として新しく作成された要求払預金を使用する彼らの権利をほぼ即座に行使する
商品やサービス、または資産の購入用。銀行負債(銀行預金)は世帯によって使用され、
小切手または振替の形での取引のための銀行会社。顧客はまた、で要求払預金を引き換えることができます。
現金の使用を可能にするために、フィアットマネー(政府によって保証されています)に対する額面金額(ドル/ドル)
支払いまたは支払いをすること。政府はまた、いくつかの種類の銀行負債を
税金の支払い
一方、銀行の準備金は、銀行間の支払い(または銀行間決済)および支払いに使用されます。
中央銀行に行った。したがって、銀行の「債権者」が支出または
より多くの現金を保有することを選択すると、個々の銀行に対する準備金の対応する損失が生じる。銀行はそれから
資産の売却またはその負債の増加(追加の準備金の借入)により、準備金の損失を補填します。
銀行間市場(米国では連邦資金市場と呼ばれる)は、次のような準備金残高をシャッフルするように機能します。
加盟(民間)銀行は中央銀行と協力して、これらの各銀行がその準備金を満たすことができるようにする。
指定された期間の終わりには、単純にゼロの残高になる可能性があります。
日であると仮定することができます)。しかしながら、全体として、そのような活動は準備金をある銀行から別の銀行に移すだけです。もっとあれば
準備金は合計で必要とされ、それらは中央銀行によって供給されなければなりません。
彼らがローンを作る前に預金を待つことからかけ離れて、現実の世界の銀行は彼らの貸借対照表を拡大する
下記のように貸し出し
ローンは預金を作成します
ローンは預金を生み出し、それは事後に積立金によって裏付けられます。ローン(クレジット)を拡大するプロセス
これは新しい銀行負債を生み出し、銀行の準備金ポジションとは無関係です。利益の追求では、
銀行は融資を求め、正当性に従ってそれらを評価する信用力のある顧客から申請書を受け取ります
2008年の世界金融危機へのリードアップではあるが、検証プロセスは
とてもゆるい
銀行の融資部門が信用を拡大することを禁じる唯一のことは、信用できる申請者がいないことです。
これは、悲観論の時代に銀行が適格基準を引き上げたことによるものか、または信用できる場合に発生する可能性があります。
顧客は将来の不確実性のためにローンを探すのが嫌です
主な洞察は、必要な準備金が銀行に残されているバランスシートの拡大は、
それがローンに期待できるリターンに影響を与えます。これは中央銀行が正当化するかもしれない「ペナルティ」率の結果です
割引窓口(引当金を必要とする銀行への貸付のための中央銀行の施設)を通して
それがそれに対する請求をカバーするためにそれが日の終わりに必要とする準備金に足りません。しかし、それは妨げることは決してないだろう
そもそも融資を行う銀行の能力。したがって、中央銀行が可能であると仮定することはまったく間違っています。
より多くの準備金をシステムに追加することによって、銀行が信用を拡大する能力に影響を与えます。これに対処します
第23章でより詳細な命題

10 Money and Banking

155

Bank managers generally neither know, nor care, about the aggregate level of reserves in the banking system.

Certainly, no loan officer ever checks the individual bank's reserve position before approving a loan. Bank lend-

ing decisions are affected by the price of reserves and expected returns, not by reserve positions. If the spread

between the rate of return on an asset (a security or a loan) and the cost of borrowing reserves is wide enough,

even a bank that is already deficient in reserves will purchase the asset or make a loan and cover the reserves

needed by purchasing (borrowing) reserves in the interbank market. The interbank market connects the banks

which lend reserves to and borrow reserves from each other when needed.

The important point is that when a bank originates a loan to a firm or a household, it is not lending reserves.

Bank lending is not easier if there are more reserves, just as it is not harder if there are less. Bank reserves do not

fund money creation in the way that is claimed in the money multiplier and fractional reserve deposit story;

banks do not wait for deposits to come in before they make loans.

The main difference between banks and other types of firms involves the nature of the liabilities. Banks 'make

loans' by purchasing the IOUS of 'borrowers'. This results in a bank liability, usually a demand deposit, at least

initially, that shows up as an asset of the borrower. Thus, a customer of a bank who secures a loan is simultan-

ev

eously a 'creditor' of the bank, due to holding a demand deposit, but also a 'debtor' to the bank. These creditors

will almost immediately exercise their right to use the newly created demand deposits as a medium of exchange

for purchases of goods and services, or assets. Bank liabilities (bank deposits) are used by households and non-

bank firms for transactions in the form of cheques or transfers. Customers can also redeem demand deposits at

par (dollar for dollar) against fiat money (which is guaranteed by the government) to enable cash to be used for

purchases or making payments that are due. The government will also accept some kinds of bank liabilities in

payment of taxes

In turn, bank reserves are used for payment (or interbank settlement) among banks and for payments

made to the central bank. Thus, when bank 'creditors' draw down their demand deposits, by either spending or

choosing to hold more cash, a corresponding loss of reserves for the individual bank results. The bank may then

either sell an asset or increase its liabilities (borrowing additional reserves) to cover the loss of reserves.

The interbank market (called the federal funds market in the US) functions to shuffle the reserve balances that

the member (private) banks keep with the central bank to ensure that each of these banks can meet its reserve

targets, which might be simply zero balances at the end of a specified period of time (that for simplicity, we

could assume is a day). In aggregate, however, such activities only shift reserves from one bank to another. If more

reserves are needed in total, they must be supplied by the central bank

Far from waiting for deposits before they create loans, banks in the real world expand their balance sheets by

lending as described below

Loans create deposits

Loans create deposits that are then backed by reserves after the fact. The process of extending loans (credit),

which creates new bank liabilities, is unrelated to the reserve position of the bank. In the pursuit of profit,

banks take applications from creditworthy customers who seek loans and assess them according to the verity

of the application, although in the lead-up to the Global Financial Crisis of 2008, the validation process became

very lax

The only thing that constrains the bank loan desks from expanding credit is a lack of creditworthy applicants,

which can be due to banks raising the qualifying standards in times of pessimism, or can occur if creditworthy

customers are loath to seek loans because of future uncertainty

The major insight is that any balance sheet expansion that leaves a bank short of the required reserves may

affect the return it can expect on the loan. This is a consequence of the 'penalty' rate the central bank might exact

through the discount window (the central bank facility for lending to banks in need of reserves) should the bank

fall short of the reserves it requires at the end of the day to cover the claims on it. However, it will never impede

the bank's capacity to make the loan in the first place. It is thus quite wrong to assume that the central bank can

influence the capacity of banks to expand credit by adding more reserves into the system. We will address this

proposition in more detail in Chapter 23


156
通貨。お金と銀行
銀行は準備金を貸し出さない
「ローンが預金を生み出す」という洞察の必然的な結果は、銀行が準備金を貸し出していないということです。
銀行の準備金は実際にどのような役割を果たしているのでしょうか。
銀行は、支払いシステムの一環として、中央銀行との間で準備金を計上しなければなりません。引当金が使用されます
銀行間支払いをする。毎日、これらの銀行間取引を通じて何百万もの取引が調整(決済)されています
支払い例えば、銀行Aに引き出され、銀行Bに預け入れられた小切手は、銀行から送金された資金を見るでしょう。
Aの準備金は銀行Bのそれにバランスをとります
特定の銀行がそれ自体に対してすべての日々の請求を解決するのに必要な準備金の量に足りないと判断した場合
それから、それは最初に他の銀行からの準備金を借りてみることができます。
その特定の日の要件。しかし、20章と23章で見るように、全体的な不足(あるいは過剰)は
銀行システム全体にわたる準備金は、銀行に準備金を提供する中央銀行によって修正されなければならない(
不足の場合)、または過剰の場合はシステムからそれらを排出することがあります。この中央銀行の介入は
我々が流動性管理の役割と呼んでいるものであり、銀行が準備金の全体的な水準を管理することを可能にしている。
その金利目標と一致している。例えば、ある特定の日に過剰な準備金がある場合
(取引を決済するのに必要な量を超えて)そして中央銀行はいかなる競争力も提供しない。
彼らに還元し、それらの超過を保有している銀行はそれらを運転する効果を持っている夜通しそれらを貸し出すことを試みるでしょう
短期金利を引き下げます。中央銀行はこれらの準備金を(国債を
銀行は、夜間の銀行間金利を維持するために、準備金口座への引き落としを行います。
目的のポリシー(ターゲット)レートと同じです。これについては23章でさらに学びます。
そのこと
内生的なお金
私たちは、新古典派の教科書に載っている物語とは異なり、現実世界では中央銀行は
マネーサプライを管理しないでください。言い換えれば、貨幣供給は内生的な貨幣であり、
銀行資金の供給は、銀行の融資に対する需要と銀行の意欲によって「内生的に」決定される
貸す(預金の作成を引き起こす)。新古典派理論は、お金が
供給は外因性であり、貨幣ベースと相互作用する貨幣乗数を通じて決定される。
新古典派は中央銀行の管理下にあると信じる
銀行ローンに対する需要は、民間経済主体(以下を含む)の支出決定によって決まる。
資産購入に関する決定を行うこと。これらの影響を受ける可能性がありますが、非常に間接的にのみ、
興味があります。銀行は、誰かがにIOUを発行することによって銀行のお金を「借りる」ことを喜んでいるという理由だけでローンを供給します
銀行。これは、金利が貸付金の供給と需要によって決定できないことを意味します。
需要と供給は独立していません。むしろ、銀行は短期の個人向け貸付市場における価格設定者です。
それから彼らはある量の配給量でローンの需要を満たす
希望のある借り手が進んで支払うことができると思っている場合でも、ローンの要求は拒否されます。
その価格で。言い換えれば、いくつかの
金利。
人口の大部分をこのように数量配分する理由はいくつかあります。銀行
借り手の債務不履行リスクを心配するかもしれませんが、金利を引き上げることができないかもしれません。
デフォルトリスクをカバーするのに便利です。量配給は価格配給よりも優れています。
いくつかの借り手に課される金利。また、銀行はおそらく借り手よりも優れた情報を持っています
デフォルトリスクについて。例えば、新しいレストランを開くことを望む借り手は、確信を持っていないかもしれません。
業界の倒産率に関する情報を評価したり、単に楽観的すぎる可能性があります。もう一方の
一方で、銀行は未来を知ることができないので、経験則に基づいて行動しなければならない(例:非公式)
ローンの規模を制限する規則)いくつかの数量配給は、理にかなっていない、おそらく差別的にさえなり得ます。
銀行は伝統的に特定の種類のローンを放棄してきたか、企業内の特定のグループに貸し出すことに消極的である。
自治体。重要な点は、融資の供給が単に融資需要に合わせて調整されていないことです。
金利。
短期小売金利は、短期卸売金利に対する値上げと見なすことができます。まさに
マークアップを決定するもの(およびそれが可変かどうか)は物議を醸していますが、ここでの分析には重要ではありません。
(ムーア、1988年を見なさい)。

156

CURRENCY. MONEY AND BANKING

Banks do not loan out reserves

A corollary of the 'loans create deposits' insight is that banks do not loan out reserves, which raises the question

of what role do bank reserves actually play?

Banks must hold reserve balances with the central bank as part of the payments system. The reserves are used

to make interbank payments. Each day millions of transactions are reconciled (settled) through these interbank

payments. For example, cheques drawn on Bank A and deposited at Bank B will see funds transferred from Bank

A's reserve balances to those of Bank B

If a particular bank finds itself short of the quantity of reserves necessary to resolve all the daily claims against

it, then it can first try to borrow reserves from other banks that might have excess reserves in relation to their

requirements on that particular day. But, as we will see in Chapters 20 and 23, an overall shortage (or excess) of

reserves across the banking system must be rectified by the central bank which provides reserves to banks (in the

case of a shortage) or may drain them from the system in the case of an excess. This central bank intervention is

what we refer to as its liquidity management role and allows the bank to manage the overall level of reserves so

s consistent with its interest rate target. For example, if on any particular day there is an excess of reserves

(over and above the quantity required to settle transactions) and the central bank does not offer any competitive

return on them, banks holding those excesses will try to loan them out overnight, which has the effect of driving

down the short-term interest rate. The central bank must drain those reserves (by selling government bonds to

the banks in return for debits to the reserve accounts) to ensure the overnight interbank interest rate remains

equal to its desired policy (target) rate. We will learn more about this in Chapter 23.

that it

Endogenous money

We have stated that unlike the story presented in neoclassical textbooks, in the real world the central bank can-

not control the money supply. In other words, the money supply is endogenous money in the sense that the

supply of bank money is determined 'endogenously' by the demand for bank loans, plus the willingness of banks

to lend (which gives rise to the creation of deposits). The neoclassical theory erroneously believes that the money

supply is exogenous and determined through the money multiplier interacting with the monetary base, which

neoclassicists believe to be under the control of the central bank

The demand for bank loans is determined by the spending decisions of private economic agents (includ-

ing decisions regarding asset purchases). These can be affected, but only very indirectly, by the loan rate of

interest. Banks supply loans only because someone is willing to 'borrow' bank money by issuing an IOU to

banks. This means that the interest rate cannot be determined by the supply of and demand for loans since

supply and demand are not independent. Rather, banks are price setters in short-term retail loan markets

They then meet the demand for loans with some quantity rationing

requests for loans are refused, even where aspiring borrowers claim to be willing and able to pay the going

at that price. In other words, some

interest rate.

There can be several reasons for such quantity rationing of large segments of the population. Banks

might worry about the default risk of some borrowers but might not be able to raise interest rates suffi-

ciently to cover the default risk. Quantity rationing is then superior to price rationing, that is, raising the

interest rate charged to some borrowers. Also, banks probably have better information than do borrowers

about default risks. For example, the borrower who wishes to open a new restaurant might not have accu-

rate information about bankruptcy rates in the industry or might simply be overly optimistic. On the other

hand, banks can never know the future, so must operate based on rules of thumb (for example, informal

rules that restrict loan size). Some quantity rationing can even be irrational, perhaps discriminatory, because

banks have traditionally forgone certain kinds of loans or are reluctant to lend to certain groups in the com-

munity. The key point is that the supply of loans does not simply adjust to the demand for loans at some

interest rate.

The short-term retail interest rates can be taken as a mark-up over short-term wholesale interest rates. Exactly

what determines the mark-up (and whether it is variable) is controversial, but not important to our analysis here

(see Moore, 1988).


10お金と銀行
卸売金利は、最後に、中央銀行の政策の影響下にあります。個々の銀行は卸売を使用しています
個人向けローンと預金のミスマッチを是正するための市場。ほとんどの銀行は正確に調整できないでしょう
彼らの小売ローンと預金。銀行によっては、預金に留めることができるよりも多くの個人向け貸付を行うことができるようになるでしょう。
他の人が預金者よりも少ないローンの顧客を見つける一方で、したがって、準備金の損失を被るので、彼らは
準備金の剰余金。銀行は卸売市場を利用して、卸売負債を発行して準備金を「購入」します。
(例えば、交渉可能な大額面の預金証書(CD)、または中央銀行の資金を借りることによって)
余剰銀行は余剰準備金を売却します。
上述のように、中央銀行は一晩の銀行間金利を設定する。それからこの率は他の不足を決定します
アービトラージによる長期卸売利率(主に値上げによるが、値下げによる)。
157
概要
新古典派の立場は、新しい預金が提供されると銀行は活用する(信用を生み出す)が
端数準備金の要件により制約を受ける。中央銀行はおそらく通貨を管理することができるので
基本的には、中央銀行が貨幣の供給を管理できると主張している。
MMTは、現実の世界で何が起きているのかを反映して、中央銀行が金融機関を統制できないことを示しています。
なぜなら、金融政策は中央銀行が目標の銀行間金利と所得を設定することによって行われるからである。
銀行がこの時点で互いに貸し借りできるように、適切な水準の準備金を銀行システムに割り当てる
目標レート(詳細については、第20章と第23章を参照)。第二に、銀行はその準備金のポジションに制約されていません。
特定の顧客に融資を行うかどうかを決定します。
銀行にとって利益がある、それはローンを作り、そして他の銀行から借りることによって十分な準備金を獲得するでしょう
または中央銀行。したがって、ローンを推進する預金の新古典主義の立場とは対照的に、MMTはローン
預金を促進する。第三に、総合的なマネーサプライの成長は、まとめて言えば、融資の需要と
通貨ベースは、内生的な金融成長が中央銀行に与える圧力に適応しています。
特定の政策金利を維持するというその探求。それ故にお金の供給は内生的に決定されます
貨幣の価格(短期金利)は、中央銀行の政策によって外的に決定されます。
銀行の信用創造の一例:バランスシート分析
典型的な銀行の貸借対照表は、図10.2のようになります。
貸借対照表のエントリは、小切手と普通預金です。彼らは銀行のIOUSであることに注意してください
したがって、負債として表示されます。銀行は、小切手口座の預金(およびほとんどの国の預金
貯金口座)をオンデマンド現金に変換します。銀行は、金融資産を顧客への貸付および証券の形で保有しています。
ities(つまり、国債やその他の金融資産)
一般的な会社と銀行は、正味の純資産を持つべきです。
負債合計左側の列の総資産は、負債の列の項目と釣り合います。
後者は純資産を含みます。
以下の一連の単純化された一連の貸借対照表は、銀行Aによる信用創造のプロセスを明確にするでしょう。
A銀行が図10.3の非常に単純な貸借対照表から始まると仮定します。
典型的な銀行バランスシート
図10.2
負債
資産
アカウントを確認する
普通預金口座
その他の債務
前払(ローン)
証券
引当金
その他の資産
純資産

10 Money and Banking

Wholesale interest rates, finally, are under the influence of central bank policy. Individual banks use wholesale

markets to rectify a mismatch between retail loans and deposits. Most banks will not be able to exactly reconcile

their retail loans and deposits. Some banks will be able to make more retail loans than they can retain in deposits

and thus suffer a loss of reserves, while others will find fewer loan customers than depositors, so they will have a

surplus of reserves. Banks then use wholesale markets to either 'purchase' reserves by issuing wholesale liabilities

(for example, negotiable, large denomination certificates of deposit (CDs) or by borrowing central bank funds),

while surplus banks will sell their excess reserves.

As discussed above, the central bank sets the overnight interbank rate. This rate then determines other short-

term wholesale rates (mainly by marking up, but also by marking down) through arbitrage.

157

Summary

The neoclassical position is that banks leverage (create credit) when provided with new deposits, but are con-

strained by fractional reserve requirements. Since the central bank is supposedly able to control the monetary

base, it is claimed that the central bank can control the supply of money.

Reflecting what happens in the real world, MMT demonstrates that the central bank cannot control the mon-

etary base, because monetary policy is conducted by the central bank setting a target interbank rate and provid-

ing the right level of reserves to the banking system so that banks lend to and borrow from each other at this

target rate (for more details, see Chapters 20 and 23). Second, a bank is not constrained by its reserve position in

deciding whether to make a loan to a particular customer, If the customer appears creditworthy and the loan is

profitable to the bank, it will make the loan and then acquire sufficient reserves by borrowing from other banks

or the central bank. Thus, in contrast to the neoclassical position of deposits driving loans, MMT shows that loans

drive deposits. Third, taken together, the growth in the broad money supply is driven by the demand for loans and

the monetary base adjusts to the pressures that the endogenous monetary growth places on the central bank in

its quest to sustain a particular policy interest rate. Hence the supply of money is determined endogenously while

the price of money (short-term interest rate) is determined exogenously by central bank policy.

An example of a bank's credit creation: a balance sheet analysis

The balance sheet of a typical bank looks like that in Figure 10.2.

The entries on the balance sheet are the cheque and savings accounts. Note that they are the IOUS of banks

and hence appear as liabilities. The bank promises to convert deposits in a cheque account (and deposits in most

savings accounts) into cash on demand. Banks hold financial assets in the form of loans to customers and secur-

ities (that is, treasury debt and other financial assets)

Firms in general and banks should have positive net worth, which is the difference between total assets and

total liabilities. Total Assets in the left-hand column will balance with the items in the Liability column, because

the latter includes net worth.

The following simplified series of balance sheets will clarify the process of credit creation by Bank A. Let us

assume that Bank A starts with the very simple balance sheet in Figure 10.3, which is expressed in terms of stocks.

A typical bank balance sheet

Figure 10.2

Liabilities

Assets

Cheque accounts

Savings accounts

Other liabilities

Advances (loans)

Securities

Reserves

Other assets

Net worth


158

通貨、金銭および銀行業

図10.3

銀行Aの初期貸借対照表

負債

資産

$ 200

$ 200

建物

純資産

その所有者は資金を調達し、建物を買いました。所有者の自己資本または純資産は価値と等しい

彼らが購入した建物の。 A銀行はまだ銀行業務をしていません。

今顧客が銀行に入ってきて、彼らが購入の資金を調達するために200ドルを借りたいと言っている

車。銀行は、所得税申告書、資産の証明、信用履歴、および

そうです。顧客が承認されると、銀行の貸借対照表は図10.4に示す形式になります。

銀行はちょうど200ドルの入金(見返りに顧客の小切手口座への入金)を作成した。

顧客のIOUのために、または200ドルを支払うことを約束)。銀行の総資産、負債と純資産は、

今400ドル。

顧客の預金の支出に移る前に、このバランスシートを慎重に検討しましょう。

銀行は、自分が作成した入金をどこで入手しましたか?

小切手口座はex nihiloで作成されました。つまり、何もない状態から、コンピュータの元帳に数値(200)を入力することによって作成されました。

借り手に代わって。過去には、銀行は独自の紙幣を発行することもできましたが、一般的に

銀行は今それをすることができます。

銀行は、事前の入金や金庫内の現金を必要としませんでした。実際、銀行には現金がありませんでした。

この単純化された例では、金庫も中央銀行の口座に預金がありませんでした。

銀行は自分が持っているものを貸しているのではなく、自由にお金を入れること(つまり銀行の預金)をするだけです。

これらのお金の入金またはエントリーは、その負債/ IOUです。

これらの銀行IOUSを作成することで、銀行は次のことを約束します。

デポジットをオンデマンドで現金に変換します。

 - 銀行に負っている借金の支払いでそれらのIOUSのいずれかを受け入れます。

当座預金口座は、オンデマンドで現金に変換し、次の形式で支払いを受け取ることを法的に約束したものです。

銀行自身のIOUS銀行は今現金を持っている必要はありません。

銀行業務の成功(IOUの受け入れによる貸し出し、および要求払いの作成)

に依存します:

顧客が返済する能力、つまり彼らの信用力。タイムリーに作るのに問題があるのなら

彼らの借金の支払いは、これは銀行の資産の価値に影響を及ぼし、それ自身の収入は流入し、最終的には

銀行の自己資本、銀行の自己資本比率、および株主資本利益率に影響します。

銀行が低コストで準備金を取得する能力

顧客は現金を引き出すことを望んでいます。

 - 銀行は、顧客の後に銀行間決済を通じて他の銀行に借金を支払う必要があります。

支出(下記参照)

 - 銀行は、顧客から政府に支払われた納税を決済する必要があります。

これらの条件が満たされない場合

銀行はトラブルに巻き込まれる:それはなることができます

支払不能または流動性がない。倒産の意味

銀行の自己資本が

ゼロ以下;非流動性

ローンを示す銀行Aの貸借対照表

図10.4

負債

資産

得意先の小切手口座

+ 200ドル

それはそれを意味する

現金引き出しに対応できない

清算。したがって、銀行ができても

無制限のお金を生み出す

顧客への貸付

+ 200ドル

$ 200

建物

純資産

$ 200


158

CURRENCY, MONEY AND BANKING

Figure 10.3

Bank A initial balance sheet

Liabilities

Assets

$200

$200

Building

Net worth

Its owners have raised capital and bought the building. The owner's equity or net worth is equal to the value

of the building that they have purchased. Bank A has not engaged in any banking activity yet.

Now a customer comes into the bank and says that they would like to borrow $200 to finance the purchase of

a car. The bank checks their creditworthiness by asking for income tax returns, proof of assets, credit history, and

so on. If the customer is approved, then the bank's balance sheet takes the form shown in Figure 10.4.

The bank just created $200 of money entries (deposits in the cheque account of the customer in return

for the customer's IOU, or promise to pay $200). The bank's total assets, liabilities plus net worth, are

now $400.

Before we move on to the customer's spending of their deposit, let us examine this balance sheet carefully

Where did the bank get the money entry it created?

A cheque account was created ex nihilo, that is, from nothing, by entering a number (200) in a computer ledger

on behalf of the borrower. In the past, banks could also issue their own banknotes, but generally only central

banks can do that now.

The bank did not need any prior deposits, or any cash in its vault. In fact, the bank did not have any cash in its

vault, nor did it have any deposits in its account at the central bank in this simplified example.

The bank is not lending anything it has, it just creates money entries (that is, bank deposits), at will.

Those money deposits or entries are its liabilities/IOU..

By creating those bank IOUS, the bank promises to:

Convert deposits into cash on demand;

- Accept any of those IOUS in payment of debts owed to the bank.

The cheque account is just a legal promise to convert to cash on demand, and to accept payment in the form of

the bank's own IOUS. The bank does not have to have any cash now.

The success of the banking operation (lending by accepting an IOU, and the creation of a demand deposit)

depends on:

The capacity of the customer to repay, that is, their creditworthiness. If they have problems in making timely

payments on their debts, this affects the value of the bank's assets and its own income inflows and ultimately

affects the net worth of the bank, the bank's capital ratio, and the shareholders' return on equity.

The bank's capacity to acquire reserves at low cost if

The customer wants to withdraw cash;

-The bank needs to pay debts to other banks through an interbank settlement following the customer's

spending(see below);

- The bank needs to settle tax payments made by the customer to the govern ment.

If these conditions are not satisfied the

bank gets into trouble: it can become

insolvent or illiquid. Insolvency means

that the bank's net worth falls to or

below zero; illiquidity

Bank A balance sheet showing loan

Figure 10.4

Liabilities

Assets

Cheque account of customer

+$200

means that it

cannot meet cash withdrawals or

clearing. Thus, even though banks can

create unlimited amounts of money

Loan to customer

+ $200

$200

Building

Net worth

$200


10お金と銀行

159

自動車の購入を示す銀行Aの貸借対照表

図10.5

預金、彼らはインセンティブを持っていません

そうなるかもしれないのでそうする

不採算。

顧客がいるとどうなりますか

資産の変更

負債の変動

顧客の小切手口座

 -  $ 200

銀行Bによる引当金

今自動車ディーラーに200ドルを支払う

銀行Bに銀行口座がありますか。の

銀行Aと銀行Bのバランスシート

+ 200ドル

それぞれ図10.5と10.6のように。

(私たちは今ちょうど扱っていることに注意してください

自動車の購入を示す銀行Bの貸借対照表

図10.6

資産および負債の変動に伴い

レベルではなく)

資産の変更

負債の変動

の形での銀行Aの負債

銀行Aの準備金に対する請求

+ 200ドル

カーディーラーの小切手口座

+ 200ドル

顧客の小切手口座は

その間に200ドルの減少

車を追いかけるが、取引は

銀行Aでの顧客のアカウントの残高の減少と自動車の残高の増加に限定されません。

銀行Aは現在銀行Bの借金200ドルを負っており、この債務を決済するために準備金が必要ですが、準備金はありません。

それはどこで準備金を得ますか?

銀行は準備銀行口座を中央銀行に保管する必要があります。これらの準備金は中央銀行の負債です。

銀行や銀行の資産、および支払い(または決済)システムが機能することを保証するための機能

スムーズにこのシステムは、小切手のように銀行間で毎日行われる何百万ものトランザクションに関連しています。

市民や企業、その他の団体からの入札首尾一貫した引当金システムがなければ、銀行Aは容易に見つけることができます。

それ自体は、顧客の口座から引き出され、で提示された小切手に基づいて銀行Bの要求に資金を供給することはできません。

カーディーラーのそばの銀行B

銀行Aは、最も費用のかからない資金源から準備金を受け取ります。それは資産を売るかもしれません、しかし、我々の例では、銀行

建物は1つだけなので、そのように準備金を得るのは非常に費用がかかります。銀行Aは、もしあれば債券を売却することができます。

他の銀行(国内外の銀行)または中央銀行から準備金を借りることができます。を取得する一般的な方法

準備金は、準備金の独占供給者である中央銀行から借りることです。図10.7ドキュメント

これらの準備金の取得に関連する、銀行Aの貸借対照表への最新の変更。

中央銀行の貸借対照表への変更

A銀行にはB銀行との債務を解決するための準備金がありますので、2つの銀行の残高の変化

シートを図10.9と図10.10に示します。

両銀行間の債務は解決された。銀行Aの最終貸借対照表は、図10.11のようになります。

顧客への融資で受け取る利子が、利子よりも大きい限り、銀行Aはお金を稼ぎます。

t準備金を中央銀行に支払う。

B銀行の貸借対照表は、

図10.12に示します。とする

B銀行は、

中央銀行からのローンを示す銀行A貸借対照表

図10.7

自動車販売店の口座を確認する

への車の販売により増加

負債の変動

資産の変更

顧客。

+ 200ドル

中央銀行への借金

+ 200ドル

センターの最終貸借対照表

予約する

すべての取引が表示された後のトラル銀行

図10.13に示します。

これらの操作のどれも注意してください

現物現金の送金を伴う。それ

すべての簿記記入が行われたか

コンピュータネットワークを介してデジタル的に。

また、表示しただけであることに注意してください。

直接関連する資産と負債

ローンを示す中央銀行の貸借対照表

図10.8

負債の変動

資産の変更

+ 200ドル

予約する

+ 200ドル

銀行Aへの準備ローン


10Money and Banking

159

Bank A balance sheet showing purchase of car

Figure 10.5

deposits, they have no incentive to

do so because they may become

unprofitable.

What happens if the customer

Change in Assets

Change in Liabilities

Cheque account of the customer

-$200

Reserves due to Bank B

now pays $200 to a car dealer who

has a bank account at Bank B? The

balance sheets of Banks A and B look

+$200

like Figures 10.5 and 10.6, respectively.

(Note that we are now just dealing

Bank B balance sheet showing purchase of car

Figure 10.6

with the change in assets and liabilities

rather than their levels.)

Change in Assets

Change in Liabilities

Bank A's liabilities in the form of

Claim on Bank A reserves

+$200

Cheque account of car dealer

+$200

the customer's cheque account have

dropped by $200 through the pur-

chase of a car, but the transaction is

not confined to the reduced balances in the customer's acccount at Bank A and the increased balances of the car

dealer at Bank B. Bank A now owes Bank B $200 and needs reserves to settle this debt, but does not have reserves.

Where does it get the reserves?

The banks are required to keep reserve accounts at the central bank. These reserves are liabilities of the cen-

tral bank and assets of the banks, and function to ensure that the payments (or settlements) system functions

smoothly. That system relates to the millions of transactions that occur daily between banks as cheques are

tendered by citizens and firms and other bodies. Without a coherent system of reserves, Bank A could easily find

itself unable to fund Bank B's demands based on the cheque drawn on the customer's account and presented at

Bank B by the car dealer

Bank A will get the reserves from the source that is the least costly. It may sell assets, but in our example, Bank

A only has a building so it would be very costly to get reserves that way. Bank A could sell bonds if it had any, or

it could borrow reserves from other banks (domestic or foreign) or the central bank. A common way to get the

reserves is to borrow from the central bank, which is the monopoly supplier of reserves. Figure 10.7 documents

the latest change to Bank A's balance sheet, associated with obtaining these reserves, while Figure 10.8 shows the

changes to the central bank's balance sheet

Now that Bank A has the reserves it can settle its debt with Bank B. The changes to the two banks' balance

sheets are shown in Figures 10.9 and 10.10.

The debt between the two banks has been settled. The final balance sheet of Bank A looks like Figure 10.11

Bank A makes money as long as the interest it receives on the loan to the customer is higher than the interest

t pays to the central bank on the reserves.

The balance sheet of Bank B is

shown in Figure 10.12. We assume

that Bank B had reserves prior to the

Bank A balance sheet showing loan from central bank

Figure 10.7

cheque account of the car dealer being

increased by the sale of the car to the

Change in Liabilities

Change in Assets

customer.

+$200

Debt to central bank

+$200

The final balance sheet of the cen-

Reserve

tral bank after all transactions is shown

in Figure 10.13.

Note that none of these operations

involved any transfer of physical cash. It

was all bookkeeping entries conducted

digitally through computer networks.

Also, note that we have only shown

the assets and liabilities directly related

Central bank balance sheet showing loan

Figure 10.8

Change in Liabilities

Change in Assets

+$200

Reserve

+$200

Reserve loan to Bank A


160

通貨。お金と銀行

私たちの例に。もちろん、民間銀行

中央銀行には他にもたくさんある

資産および負債、ならびに自己資本

貸借対照表に

実際には、中央銀行はそうするでしょう

図10.9

借金の決済を示す銀行Aの貸借対照表

資産の変更

負債の変動

 -  $ 200

引当金

 -  $ 200

銀行Bによる引当金

同盟者は銀行に準備金を前払いしない

直接セキュリティで保護されていない形式で

前進;代わりにそれは担保を要求します

引き換えに(通常は国債)

とより少ないのための資金を提供します

担保の価値。 A銀行に

300ドルの債券、それは中央にそれを引き渡す

準備金と引き換えに銀行。中心 - 

トラル銀行は、銀行に285ドルしか与えないかもしれません。

図10.10

借金の決済を示す銀行Bの貸借対照表

資産の変更

負債の変動

銀行Aに対する請求

 -  $ 200

引当金

+ 200ドル

割引率が5パーセントの場合割引率は、中央銀行が信用を制限しようとすることができる1つの方法です。

経済における創造。

図10.11

銀行Aの最終貸借対照表

負債

資産

$ 200

中央銀行への借金

$ 200

顧客への資金提供

建物

$ 200

純資産

$ 200

銀行Bの最終貸借対照表

図10.12

負債

資産

$ 200

カーディーラーの小切手口座

引当金

$ 200

中央銀行の最終貸借対照表

図10.13

資産

負債

銀行Aへの準備ローン

$ 200

引当金

$ 200


160

CURRENCY. MONEY AND BANKING

to our example. Of course, private bank

and the central bank have many other

assets and liabilities, as well as net worth

on their balance sheets

In practice, the central bank will isu

Figure 10.9

Bank A balance sheet showing settlement of debt

Change in Assets

Change in Liabilities

-$200

Reserves

-$200

Reserves due to Bank B

ally not advance reserves to the bank

directly in the form of an unsecured

advance; instead it will ask for collateral

(usually a treasury security) in exchange

and will provide funds for less than the

value of the collateral. So, if Bank A has a

$300 bond, it surrenders it to the central

bank in exchange for reserves. The cen-

tral bank might only give the bank $285

Figure 10.10

Bank B balance sheet showing settlement of debt

Change in Assets

Change in Liabilities

Claim on Bank A

-$200

Reserves

+$200

if the discount rate is five per cent. The discount rate is one way in which the central bank can try to limit credit

creation in the economy.

Figure 10.11

Bank A final balance sheet

Liabilities

Assets

$200

Debt to central bank

$200

Funds advanced to customer

Building

$200

Net worth

$200

Bank B final balance sheet

Figure 10.12

Liabilities

Assets

$200

Cheque account of car dealer

Reserves

$200

Central bank final balance sheet

Figure 10.13

Assets

Liabilities

Reserve loan to Bank A

$200

Reserves

$200


10お金と銀行

161

他の銀行から、あるいは中央銀行による準備金の創出を通じて。我々はより詳細に説明します、

そしてなぜ、中央銀行は第20章の準備金の需要に対応するのか。

参考文献

Brunner、K.(1968)「貨幣と金融政策の役割」、セントルイス連邦準備銀行、50、8-24。

ムーア、B。 (1988)水平主義者と垂直主義者:ケンブリッジのクレジットマネーのマクロ経済学:ケンブリッジ大学

押す。

文末脚注

1.正統派のエコノミストは、名目金利は実質金利に期待インフレを加えたものに等しくなければならないと提案している。

実質金利は、市場で決定された実質収益であり、これは

資金のための投資需要と資金。したがって、それは実質均衡金利です。しかし、契約は

名目で、つまり名目金利で書かれている場合、名目金利は報酬を含まなければなりません

expの

(Box 10.2を参照)。多くの市場参加者は、これが債券市場に当てはまると考えています。名目上の強い信念があります

購買力を維持するために、利回りは市場によって調整されます。

dインフレ率。インフレ期待が上がるにつれてこの実質金利に加わることはフィッシャー効果と呼ばれます

その他の資料については、コンパニオンWebサイト(www.macm illanihe.com/mitchell-macro)を参照してください。

作者のビデオ、講師用マニュアル、うまくいった例、チュートリアルの質問、その他

参考文献、本文中のさまざまなグラフの作成に使用されるデータセットなど。


10 Money and Banking

161

them from other banks or through creation of reserves by the central bank. We will explain in more detail how,

and why, central banks accommodate the demand for reserves in Chapter 20.

References

Brunner, K. (1968)" The Role of Money and Monetary Policy", Federal Reserve Bank of St Louis Review, 50, 8-24.

Moore,B. (1988) Horizontalists and Verticalists: The Macroeconomics of Credit Money, Cambridge: Cambridge University

Press.

Endnote

1.Orthodox economists propose that the nominal interest rate must equal a real interest rate plus expected inflation.

The real interest rate is supposed to be the market-determined real return that will equate the saving supply of

funds with the investment demand for funds. It is thus a real equilibrium interest rate. However, as contracts are

written in nominal terms, that is, in terms of nominal interest rates, the nominal rate must include compensation

for the exp

(see Box 10.2). Many market participants believe this applies to bond markets. There is a strong belief that nominal

yields are adjusted by markets to preserve purchasing power.

d inflation rate. This addition to the real rate as inflation expectations rise is called the Fisher effect

Visit the companion website at www.macm illanihe.com/mitchell-macro for additional resources

including author videos, an instructor's manual, worked examples, tutorial questions, additional

references, the data sets used in constructing various graphs in the text, and more.