16/07/30 15:23
ティモワーニュのブログを簡単に訳してみた。
ただ、図が多いのだが、うまく張ることができなかっ
ただ、図が多いのだが、うまく張ることができなかっ
http://www.freeassociations.org/
The roots of MMT do not lie in Keynes – Bill Mitchell – Modern Monetary Theory 2015/8/25
http://bilbo.economicoutlook.net/blog/?p=31681
My own view is that many of the important insights in Keynes were already sketched out in some detail in Marx. Further, the work of the Polish economist Michał Kalecki was much deeper in insight than the work of his contemporary, Keynes. But for me the real sticking point against Keynes was his view that fiscal deficits should be balanced over the business cycle and that would allow governments to pay back debt incurred in the deficit years. That view has crippled progressive thought ever since and is antithetical to MMT.
私自身の見解では、ケインズの重要な洞察の多くはすでにマルクスである程度詳細にスケッチされています。 さらに、ポーランドのエコノミストMichałKaleckiの仕事は、彼の現代のケインズの仕事よりもはるかに洞察が深かった。しかし、私にとってケインズに対する真の注目点は、財政赤字は景気循環にわたって均衡がとれ、それによって政府が赤字期に発生した債務を返済することが可能になるという彼の見解でした。 その見解はそれ以来進歩的な思考を無力にしており、MMTとは正反対です。
Modern Monetary Theory(MMT、現代貨幣理論または現代金融理論)の日本語で読める情報を集めようと思っています。
まじめな入門一押しは、リッキー氏の
What is a balance sheet?
It is an accounting document that records what an economic unit owns (its “assets”) and owes (its “liabilities”). The difference between its assets and liabilities is called net worth, or equity, or capital.
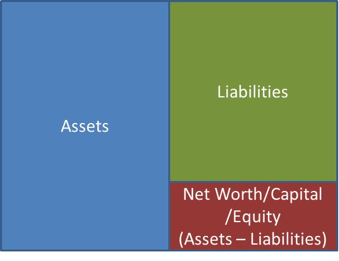
Figure 0a. A balance sheet
There are many different ways to classify assets and liabilities. For our purpose, a balance sheet can be detailed a bit more as follows:
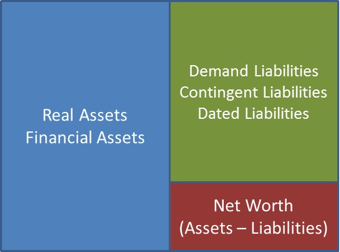
Figure 0b. A simple balance sheet
Financial assets are claims on other economic units and real assets may be reduced to physical things (cars, buildings, machines, pens, desks, inventories, etc.) but may also include intangible things (e.g., goodwill). Demand liabilities are liabilities that are due at the request of creditors (e.g., cash can be withdrawn from bank accounts at will by account holders), contingent liabilities are due when a specific event occurs (e.g., life insurance payments to a widow), dated liabilities are due at specific periods of time (e.g., interest and principal mortgage payments are due every month).
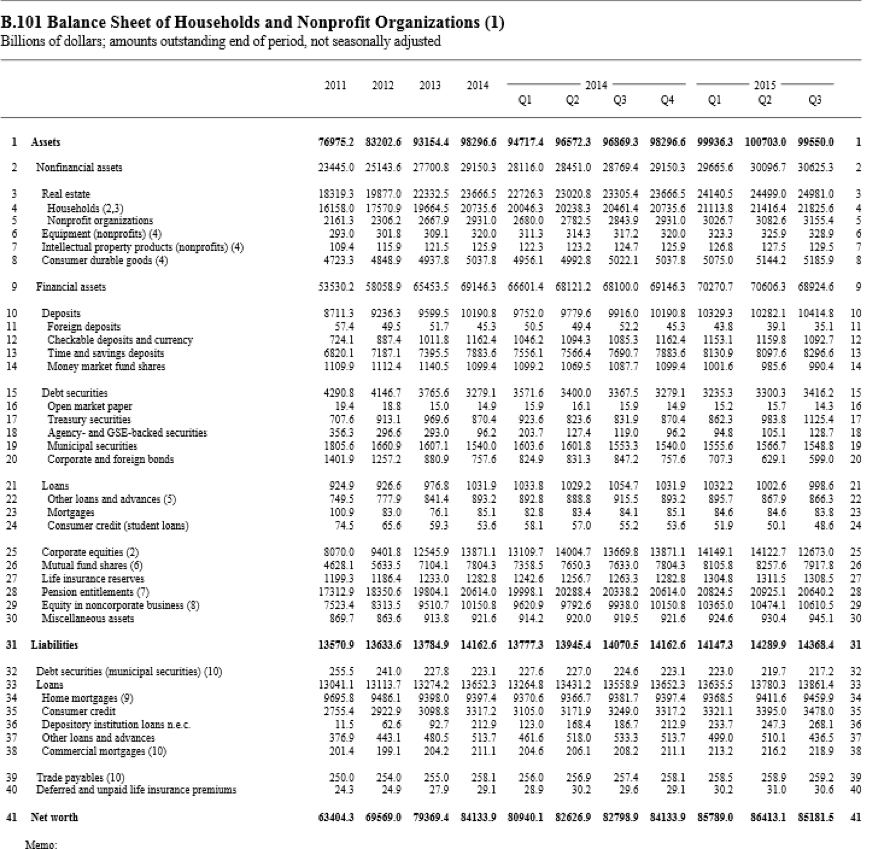
Balance sheets can be constructed for any economic unit. That unit can be a person, a firm, a sector of the economy, a country, anybody or anything with assets and liabilities. Table 1 is the balance sheet of U.S. households (and non-profit organizations) in the United States. In the third quarter of 2015, U.S. households owned $99.6 trillion worth of assets and owed $14.4 trillion worth of liabilities, making net worth equal to $85.2 trillion (99.6 – 14.4). Households held $30.6 trillion of real assets, $68.9 trillion of financial assets. Their two main liabilities were home mortgages ($9.5 trillion) and consumer credit, i.e. credit cards, student debts, etc. ($3.5 trillion).
Balance sheet rules
A balance sheet follows double-entry accounting rules so A BALANCE SHEET MUST ALWAYS BALANCE, that is, the following must always be true:
Assets = Liabilities + Net Worth
The practical, and central, implication is that a change in one item on the balance sheet must be offset by at least one change somewhere else so that a balance sheet stays balanced.
Let’s start with a very simple balance sheet. The only asset is a house worth $100k that was purchased by putting down 20k and asking for $80k from a bank:
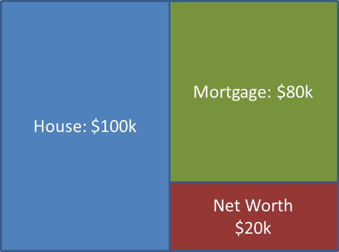
Figure 1. A simple balance sheet
What is the impact of a bank forgiving $40k of principal (i.e. outstanding amount owed) on the mortgage?
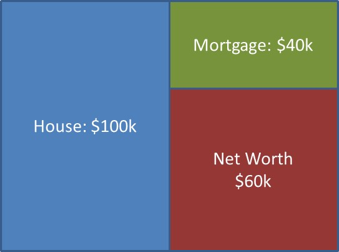
Figure 2. Effect of Repayment of Mortgage Principal
The value of mortgage went down by 40k and the value of net worth went up by 40k so that the accounting equality is preserved.
Going back to the first balance sheet, what is the impact of the value of the house going up by $20k?
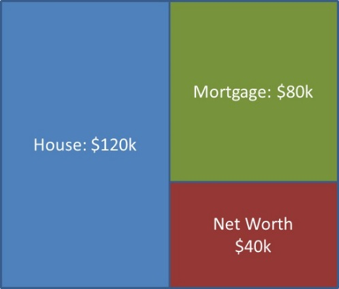
Figure 3. Effect of higher house price
The asset value went up by $20k and the net worth went up by $20 and here again the accounting equality is preserved.
Sometimes, to get to the point more quickly and to highlight the changes, economists prefer to use so-called “T-accounts” (because the shape of the table looks like a T) that record only the changes in the balance sheet.

Figure 4. T-account that records the repayment of the mortgage principal

Figure 5. T-account that records the higher house value
The offsetting is shown more clearly. It comes from opposite changes in two items on the right side of the balance sheet (Figure 4), and a change in asset and net worth by the same amount (Figure 5). Of course these are not the only two ways the offsetting is done to preserve the accounting equality. We will encounter other cases as we move forward. The point is that one must change at least two things in a balance sheet to make sure that the equality A = L + NW is preserved. One must always ask: what is the offsetting entry change? This has practical implications when studying how banks and central bank operate.
What makes the balance sheet change?
One can classify factors that change a balance sheet in three categories:
These categories are recorded more carefully in other accounting documents than the balance sheet, but this section focuses on their relation to the balance sheet.
Net Cash Flow
Cash inflows and cash outflows lead to a change in the amount of monetary balances held by an economic unit, i.e. a change in the amount of physical currency or funds in a bank account held on the asset side. Some assets lead to cash inflows while some liabilities and capital (dividend payments) lead to cash outflows.
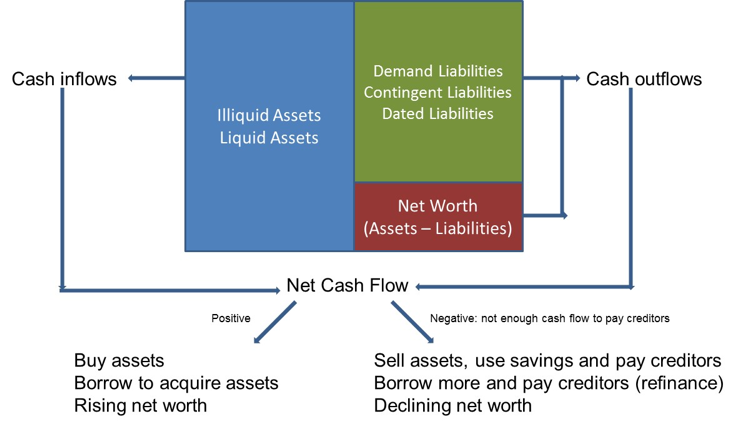
Figure 6. Balance sheet and cash flow
If the cash inflows are greater than the cash outflows, monetary assets held by an economic unit go up. The economic unit can use them to buy assets or pledge them to leverage its balance sheet (see Post 7). If net cash flow is negative, then monetary-asset holdings fall and the economic unit may have to go further into debt to pay some of its expenses.
Going back to our very simple balance sheet, assume that a salary of $40k is earned and that part of the salary is used to service a 30-year fixed-rate 10 % mortgage. Assuming linear repayment of principal to simplify (actual mortgage servicing is calculated differently), the cash flow structure looks like this:
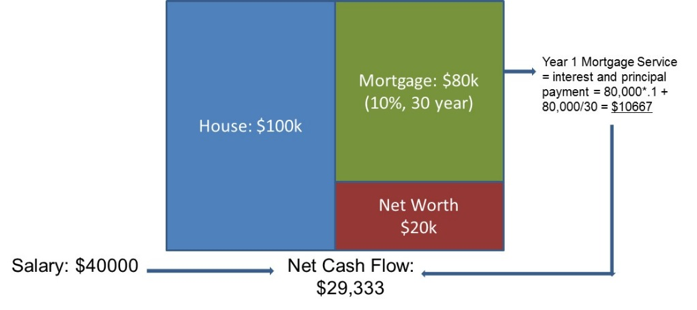
Figure 7. Balance sheet and cash flows, an example
The balance sheet at the beginning of the following year is (assuming all cash flows involve actual cash transfer instead of electronic payments):
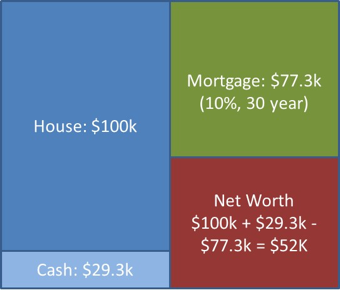
Figure 8. Balance sheet after the cash-flow impacts
Quite a few things have change in the balance sheet. There is a net inflow of cash of $29.3k, the principal of the mortgage fell by the amount of principal repaid, and net worth accounts for these two changes.
Net Income
Net income leads to a change in the net worth:
Current Net worth = Previous Net worth + Net income of the period
Net income (e.g., earnings before taxes is a proxy of net income) can be positive or negative so net worth may rise or fall. In the previous example (Figures 7 and 8), net cash flow and net income are the same thing; however, not all incomes necessarily lead to cash inflows (see Post 4, and 10).
Capital Gains and Capital Losses
Finally, the value of assets and liabilities may change because of changes in their market value. If accounting is done on a “mark-to-market” basis, i.e. by valuating balance-sheet items based on their current market value, these changes will be accounted in the balance sheet and net worth will be affected accordingly:
Current Net Worth = Previous Net Worth + Net income of the period + Net capital gains of the period
The example of Figure 3 is a simple illustration of the impact of capital gains.
The effect of a change in the market value of assets and liabilities may not be accounted in the balance sheet if they are valued on a cost basis. For financial assets, there are three options to record their value. Level 1 valuation uses the available market price. Level 2 valuation, for assets that do not have an active market, uses a proxy market as a point of reference. Level 3 valuation, also called mark-to-model (or more cynically “mark-to-myth”), uses an in-house model to give a dollar value to the asset. During the 2008 crisis, major financial institutions argued that the market prices of some assets did not reflect their true value because of a panic in markets. The Securities and Exchange Commission allowed them to move to level 2 or level 3 valuation to keep up the value of their assets. Many analysts have been critical of this decision and considered it to be a convenient way to hid major losses of institutions.
That is it for today! Following posts will apply all this to banks and central bank.
[Revised 7/21/2016]
Figure 4. T-account that records the repayment of the mortgage principal
posted by yoji at 5:22 午前
![]()
![]()

3 Comments:
このコメントは投稿者によって削除されました。
キーン『次なる金融危機』がMMTについて最後に少し触れている
信用創造についても書かれているし
最初にミンスキーの紹介があってオススメ
キーンは2008年の金融危機を予見した12人のうちのひとり
ゴドリーもそのうちのひとり
ゴドリー、キーンはミンスキーの影響を受けている
ミンスキーは政府の負債より民間負債の方が重要と考え
それを受けてゴドリーは部門ごとに数値分析をし
キーンはカオス理論を応用し視覚化した
ミンスキーは当初ケインズの影響を受けていたが
徐々にカレツキに傾倒していった
カレツキとケインズの往復書簡が残っているが
カレツキの方が資本主義の不安定性を指摘している
ミンスキーはその視角を受け継いでいる
ミンスキーは循環的な経済理論を持ち得なかったが
カレツキにはそれがあった
187 あなたの1票は無駄になりました[] 2019/05/10(金) 01:02:56.82 ID:8VKYBSKP0
キーン・(ミンスキー)モデルの3変数:
雇用率(Employment)
産出[=GDP]に占める賃金の割合(Wage Share)
民間負債の対GDP比率(Bank Share[=主流派が軽視したミンスキー的認識])
(それぞれx,y,z)
https://4.bp.blogspot.com/-2zZ3mi6JZ10/XMwwi5u6i1I/AAAAAAABigY/uNLE0bJRfx00r5xafZYcQWo3stgyGtK5wCLcBGAs/s1600/IMG_4925.PNG
https://www.nbp.pl/badania/seminaria/23v2016-1.pdf
コメントを投稿
<< Home